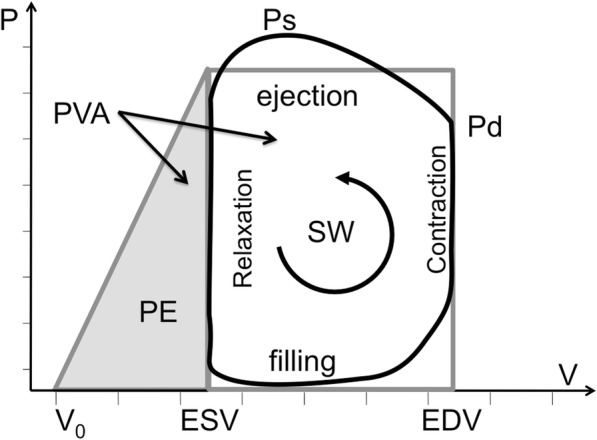
Fig. 2.

Pressure-volume schematic. The hemodynamic phases are traversed counterclockwise in one complete heart cycle (black-line). The area inside the right-hand loop defines the stroke work (SW), approximated by a rectangle (grey border); the potential energy (PE) is estimated by the end-systolic area under the grey triangle (left); and the pressure-volume area (PVA) is their sum, SW + PE. Ps and Pd are the systolic and diastolic pressures; ESV, EDV, V0, denote the end-systolic, end-diastolic and unstressed volumes, respectively
