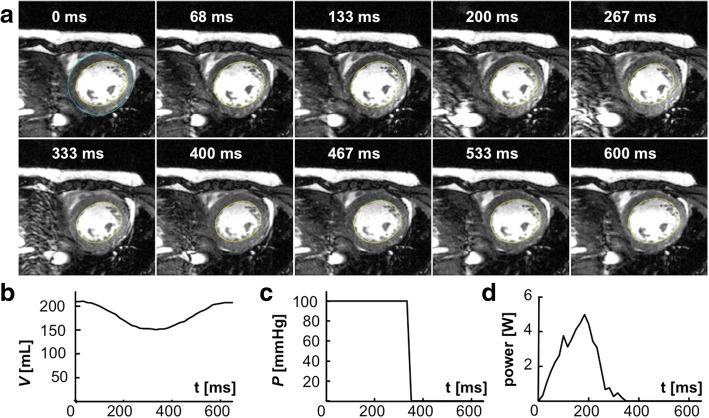
Fig. 4.
CMR and the LV volume, pressure and power waveforms for the HF patient in Fig. 3. a Short-axis images acquired at different times post-diastole (labeled), in a multi-slice 30-phase steady-state free-precession cine CMR (see Additional file 1). The endocardial borders used for quantifying SV are outlined in yellow (the epicardial border is blue in the first frame. b The volume waveform, c the scaled pressure model, and d the resulting mechanical power waveform for this patient

