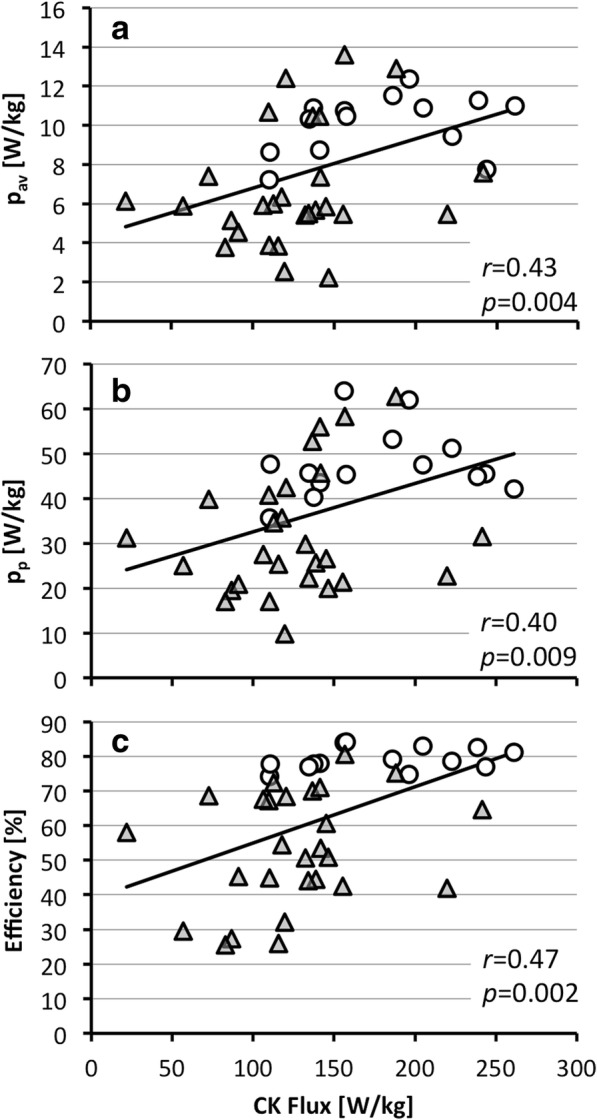
Fig. 5.

Correlation between mechanical energy and CK flux. a Average (pav) and b peak (pp) power, and c mechanical efficiency in healthy subjects (circles) and HF patients (triangles). Pearson correlation coefficients (r) and their probabilities are indicated (standard errors were 2.79, 13.1 and 16.4 respectively)
