
Figure 2.
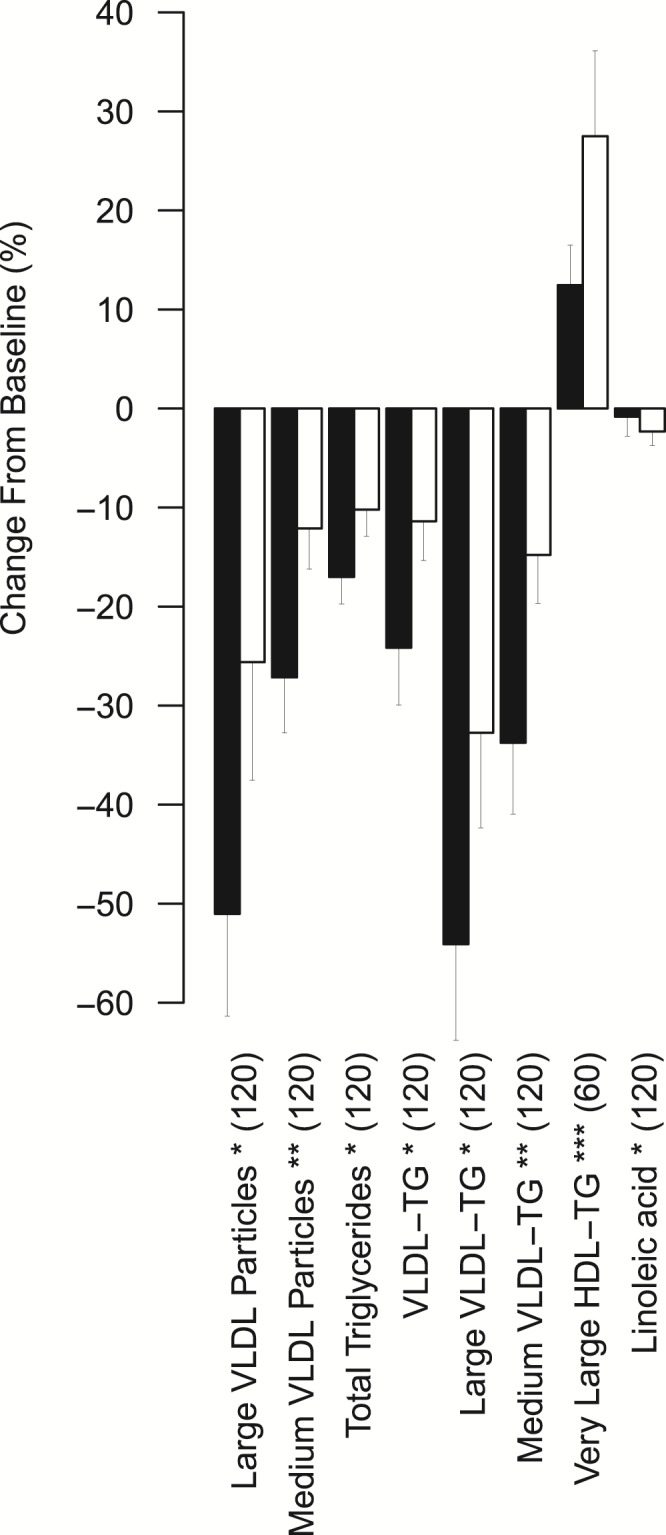
Significantly differing excursions in cotwins with higher compared with lower BMI within BMI-discordant MZ pairs during the OGTT. Black bars represent excursions in cotwins with lower BMI, and white bars represent excursions in cotwins with higher BMI within BMI-discordant MZ pairs (peak percentual excursion + SE, n = 30 pairs). Paired t tests were used to estimate significance. The peak time points are marked inside parentheses. Asterisks denote significance based on multiple-corrected P-value thresholds. *P < 0.0031; **P < 0.00063; ***P < 0.000063. LDL, low-density lipoprotein; TG, triglycerides.