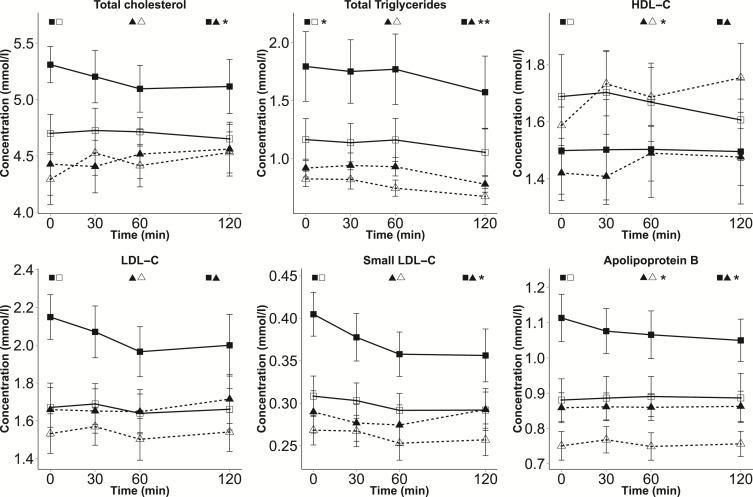
Figure 4.
Dynamic metabolite levels in subtypes of BMI discordance (continued). Mean ± SE values of selected NMR measures are presented for 4 groups at each time point during the OGTT: cotwins with higher BMI within LF-discordant MZ pairs (solid line with black squares, n = 12), cotwins with lower BMI within LF-discordant MZ pairs (solid line with white squares, n = 12), cotwins with higher BMI within LF-concordant MZ pairs (dashed line with black triangles, n = 13), and cotwins with lower BMI within LF-concordant MZ pairs (dashed line with white triangles, n = 13). Student’s t test was used to estimate significance between the AUC values of the matched cotwins with higher and lower BMI (paired testing) and between the AUC values of the two groups of twins with higher BMI (nonpaired testing). P values are marked by asterisks next to the symbols of the corresponding groups. *P < 0.05; **P < 0.01.

