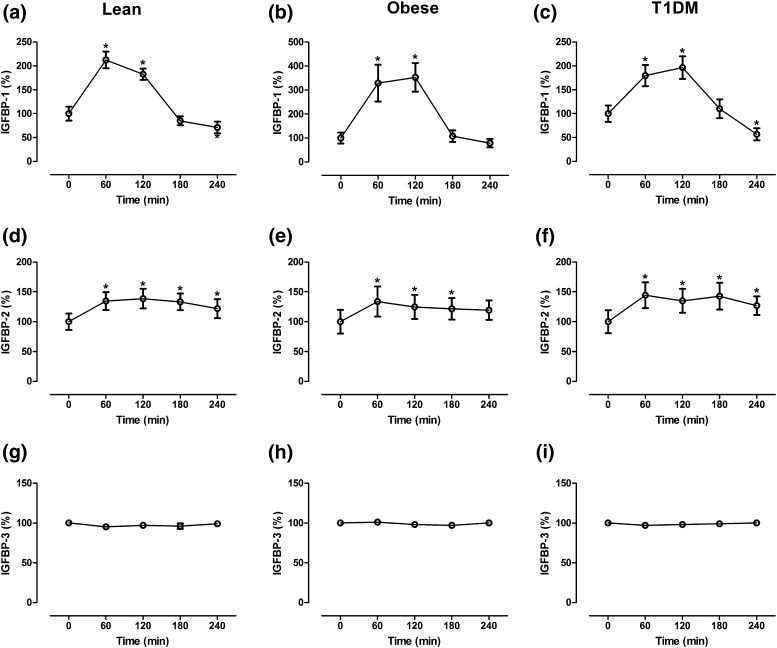
Figure 2.
Changes in (a–c) IGFBP-1, (d–f) IGFBP-2, and (g–i) IGFBP-3 in 13 lean participants, 11 obese participants, and 13 T1DM patients after administration of glucagon. Data presented as mean ± standard error of the mean. *P < 0.01. The 0-minute value was calculated as the mean of two baseline values (−30 and 0 minutes). All values are presented relative to the baseline values.

