Figure 1.
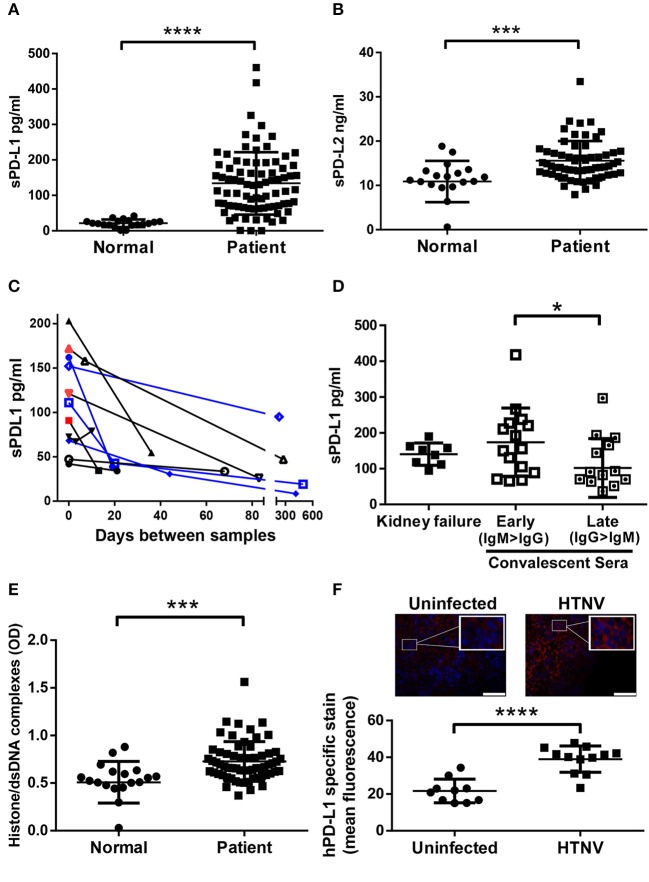
Levels of sPD-L1, sPD-L2, hantavirus-specific IgG and NETs in sera from hantavirus-infected patients. Sera from normal healthy individuals or convalescent hantavirus-infected patients (after the viremic phase) was tested by ELISA for levels of (A) sPD-L1 and (B) sPD-L2. Error bars represent the mean ± SD (****p < 0.0001, ***p < 0.001, paired Student's t-test). (C) Sequential sera samples from patients with PUUV (black) or DOBV (blue) were tested for sPD-L1. Red samples also tested additionally positive for hantavirus RNA and are therefore acute infections. (D) Levels of sPD-L1 in patients with kidney failure or in convalescence were further analyzed. Convalescent sera were separated into early convalescent (IgM dominant) or late convalescent (IgG dominant). Error bars represent the mean ± SD (*p < 0.05, paired Student's t-test). (E) The level of NETs in sera from normal healthy individuals or convalescent hantavirus-infected patients was determined as previously described (27). Error bars represent the mean ± SD (***p < 0.001, paired Student's t-test). (F) Spleen sections from uninfected or HTNV-infected humanized mice were stained for human PD-L1 (red) and nuclei (blue). HTNV-infected spleen sections show large areas of human cells with enhanced PD-L1 expression in comparison to uninfected spleen sections (upper left and right panel; inserts show higher magnification of cells; bars represent 100 μm). Slides from uninfected and HTNV-infected humanized and unreconstituted mice animals (N = 3 each group; 12 total) were analyzed using ImageJ to determine the intensity of human PD-L1 staining (Lower panel). Error bars represent the mean ± SEM (****p < 0.0001, paired Student's t-test). The samples from unreconstituted mice were used to determine the background staining. No significant difference was found in background staining in HTNV-infected or uninfected unreconstituted mice.

