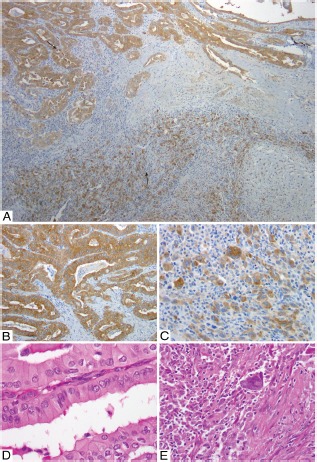
Figure 2.

A–E, Whole section of anaplastic carcinoma with associated PTC tall cell variant (PTC TCV). Both the PTC TCV and anaplastic components have BRAF V600E mutation. A, Low-power view with diffuse homogeneous 3+ immunostaining for VE1 in PTC TCV (top arrow) and anaplastic (bottom arrow) components. B, High-power view of the PTC TCV component showing 3+ VE1 immunostaining. D, Corresponding H&E staining for B. C, High-power view of anaplastic component showing 3+ VE1 immunostaining. E, Corresponding H&E staining for C.
