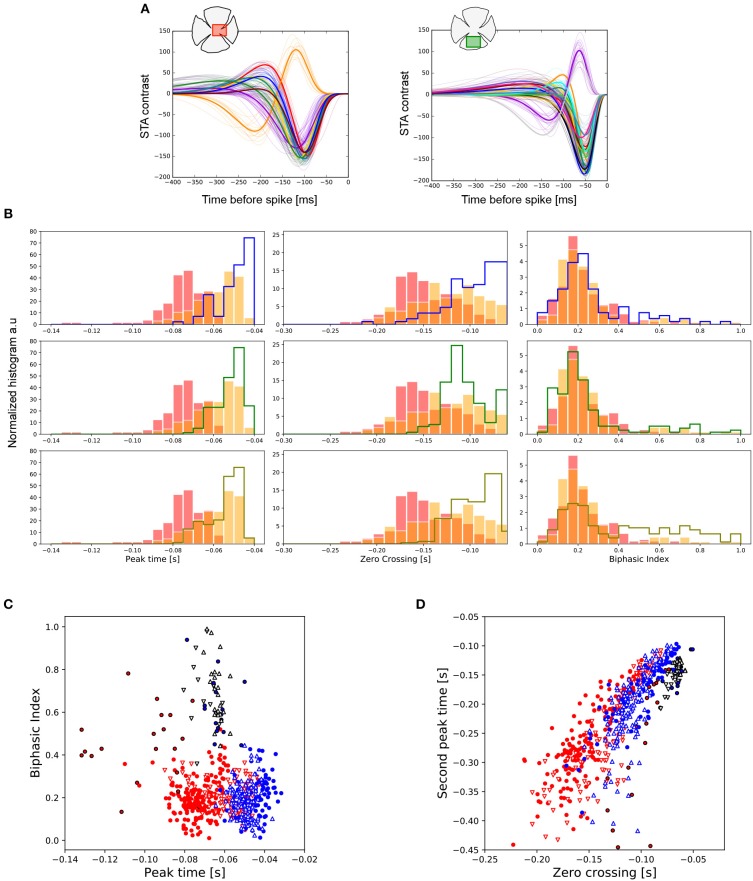
Figure 3.
Temporal features observed in central and peripheral RGCs. (A) Temporal profile of all the RGCs from one central (left) and one peripheral (right) retina region. Each color line represents the associated cluster used to visually organize different functional cell types, whose mean curve is plotted with a thick colored line. The number of clusters encountered, from left to right, was 14 and 17, respectively. (B) Distributions of the peak-time (left), zero-cross (middle) and biphasic index (right) parameters for the total number of retina pieces analyzed. The data coming from the two centers are represented in red and orange, respectively. Each row represents a comparison against a different preparation from peripheral retina. (C) Chart represented the covariation of the peak-time response vs. the biphasic index for all the experiments analyzed. Central preparations are represented in red (◦ and △) and peripheries in blue (◦ and ∇). In all the cases, ON cells are indicated in black. (D) Same as (C), but now showing the covariation of zero-crossing and second peak-time.

