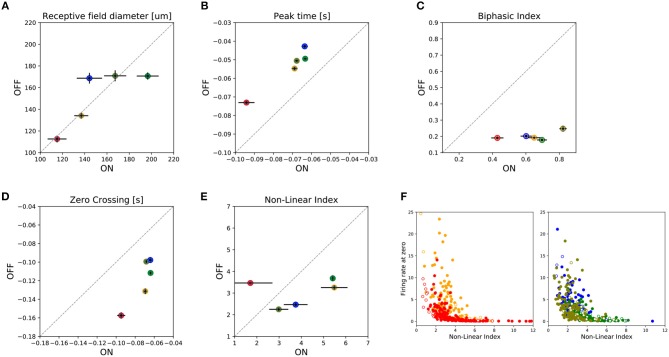
Figure 4.
Summary of asymmetries observed between ON and OFF cells. For five retina preparations, two from central and three from peripheral regions of the retina, a total of 102 ON cells and 659 OFF cells were analyzed by grouping the information as shown in the figure. Filled circles represent the median value for that parameter for a given preparation, while horizontal/vertical bars represent the SEM value for the ON and OFF population, respectively. In the figure we have represented: (A) receptive field diameter; (B) peak-time; (C) biphasic-index, (D) zero-crossing parameters, and (E) the Non-Lineal Index. Finally, (F) shows the covariation between the non-linear index parameter and the firing rate measured in the cell when the estimated linear response is zero. Empty (filled) colored circles represent ON (OFF) cells. The left (right) panel shows the data for the central (peripheral) preparations.

