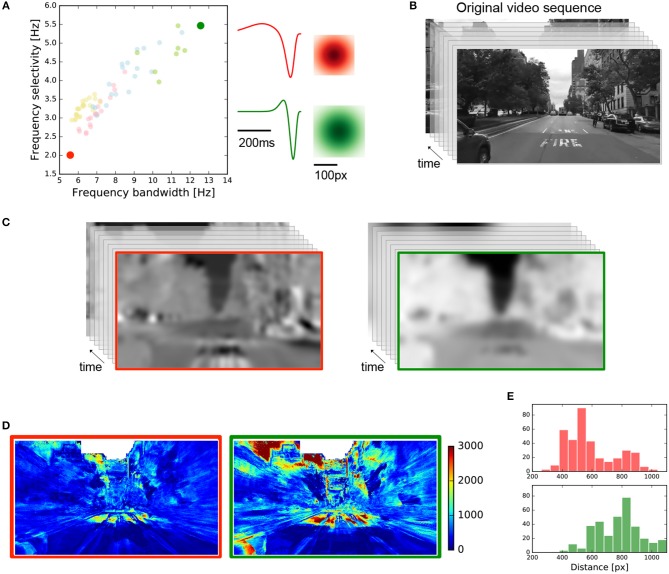
Figure 8.
Simulated linear retina response in a real scenario for two fast-biphasic OFF-RGCs. (A) Two fast-biphasic OFF-RGCs were selected from the central and peripheral retina regions, at opposite sides of the frequency response chart. Spatial and temporal profiles are shown on the right. (B) Input video sequence from New York City used in this simulation (640 x 480 pixels, 200 frames, 60 fps). (C) Resulting videos obtained after the spatio-temporal convolution of the selected RGCs RF with the input video. Red/green for central/periphery RGCs, respectively. (D) Images representing the mutual information between the input video and the resulting videos after convolution. (E) Histograms quantify the mean mutual information value contained at a given distance from the center of the image. The red histogram (top) concentrates the information at lower distance values, while the green histogram (bottom) does so at larger distances.

