
Figure 2.
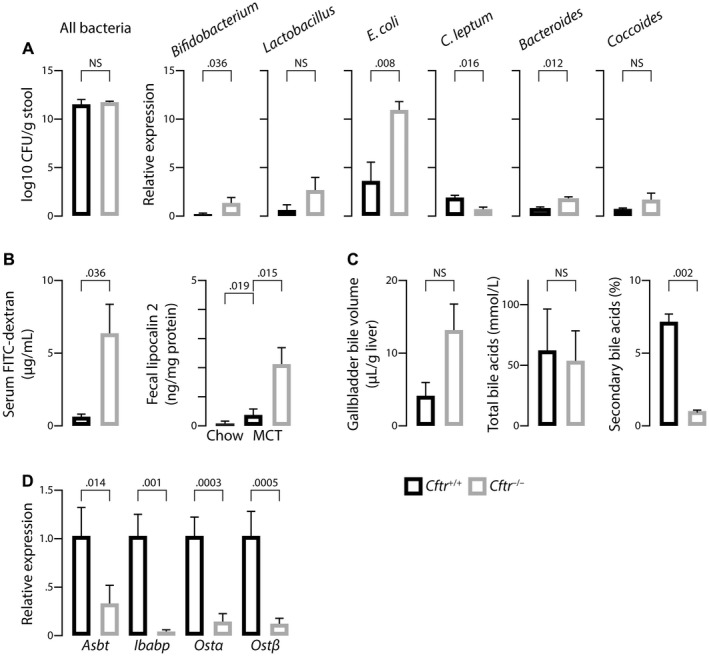
Gut–liver axis in the mouse model of CF‐related cholangiopathy. C57BL/6J Cftr‐/‐ mice and Cftr+/+ littermates on an MCT diet were subjected to the following analyses at the age of 3 months: quantification of fecal bacteria by qPCR targeting bacteria 16S ribosomal RNA (A); dosage of FITC–dextran in portal blood, following gavage (B, left panel) and enzyme‐linked immunosorbent assay (ELISA) of fecal lipocalin 2 (B, right panel); measurement of gallbladder bile volume after overnight feeding (C, left panel), total bile acid concentrations (C, middle panel), and proportion of secondary bile acids (deoxycholic acid, hyodeoxycholic acid, lithocholic acid, and their conjugates) (C, right panel) in gallbladder bile; and reverse‐transcription qPCR analyses of bile acid transporters in the terminal ileum (D). Means ± SEM of at least 4 animals.