
Figure 4.
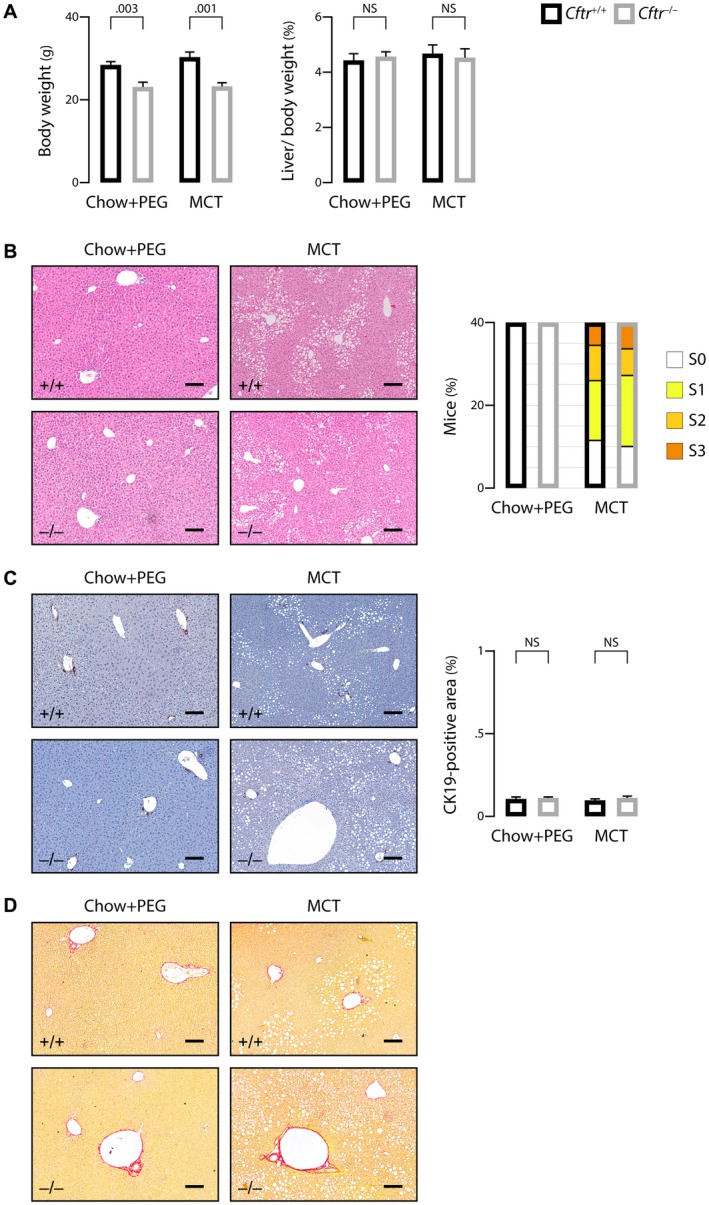
Effect of genetic background on liver phenotype in CF mice. C57BL/6J;129/Ola Cftr‐/‐ mice and Cftr+/+ littermates were randomly assigned at weaning to high MCT diet or chow diet with PEG supply and subjected to the following analyses at the age of 3 months: body weight (A, left panel) and liver‐to‐body weight ratio (A, right panel); hematoxylin and eosin staining of liver tissue sections (B, left panel) and count of animals in each group according to the score of steatosis (S0: <5%; S1: 5%‐33%; S2: 34%‐66%; S3: >66%) (B, right panel); CK19 immunostaining of liver tissue sections (C, left panel) and morphometric analysis of CK19‐immunostained areas (C, right panel); and sirius red staining (F0 according to the staging of fibrosis17 in all mice) (D). Scale bar: 100 µm; means ± SEM of at least 7 animals.