
Figure 6.
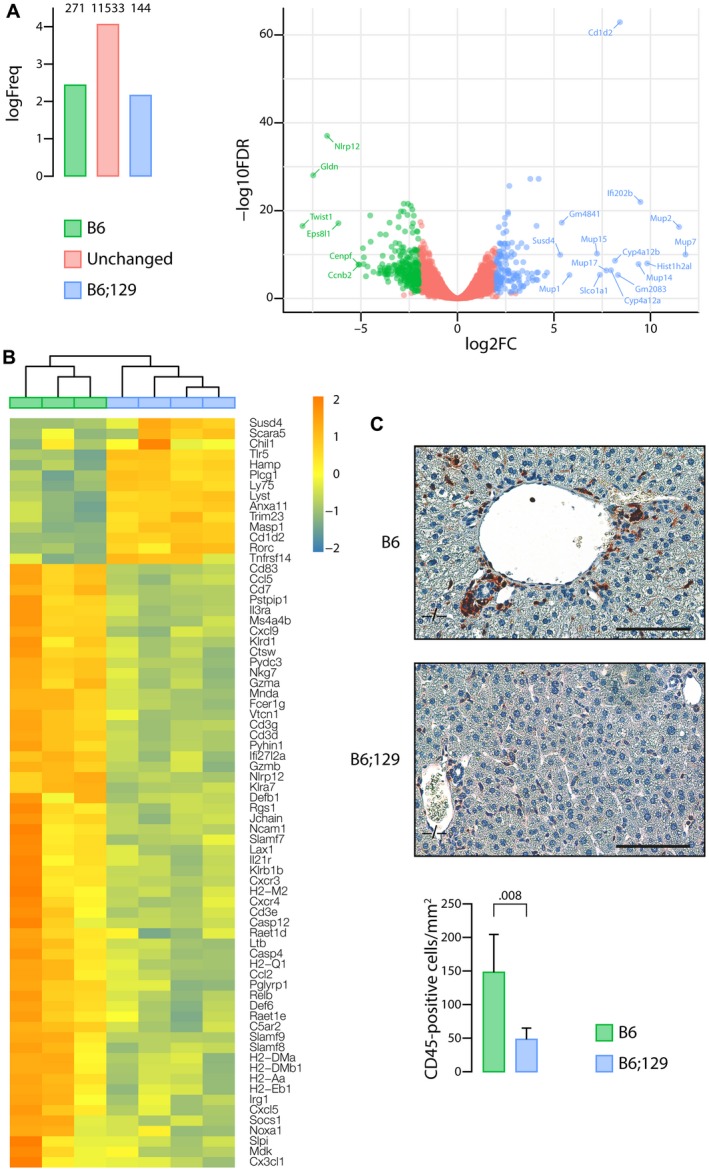
Immune‐related pathways underlying the genetic susceptibility to CF‐related cholangiopathy. Liver tissue samples from MCT‐fed Cftr −/− mice in the C57BL/6J (B6) (n = 3) or C57BL/6J;129/Ola (B6;129) (n = 4) background were subjected to RNA sequencing analyses. (A) Number of genes overexpressed in C57BL/6J (green) or in C57BL/6J;129/Ola (blue) or expressed at similar levels in both groups (red) (left panel) and volcano plot (right panel). The x axis represents the log2 of fold‐changes (log2[FC]), and the y axis represents the log10 of corrected P values (false discovery rate [FDR]) for differential gene expression analysis of the two groups (‐log10FDR). Significant overexpression of transcripts in one group versus the other was defined by a log of fold change (FC) >2 and a corrected P value <5.10‐2. (B) Heat map of differentially expressed genes with FDR <5%, related to immunity and inflammation. (C) CD45 immunostaining of liver tissue sections (upper and middle panels) and count of CD45‐positive cells (lower panel). Scale bar: 100 µm; means ± SEM of 5 animals.