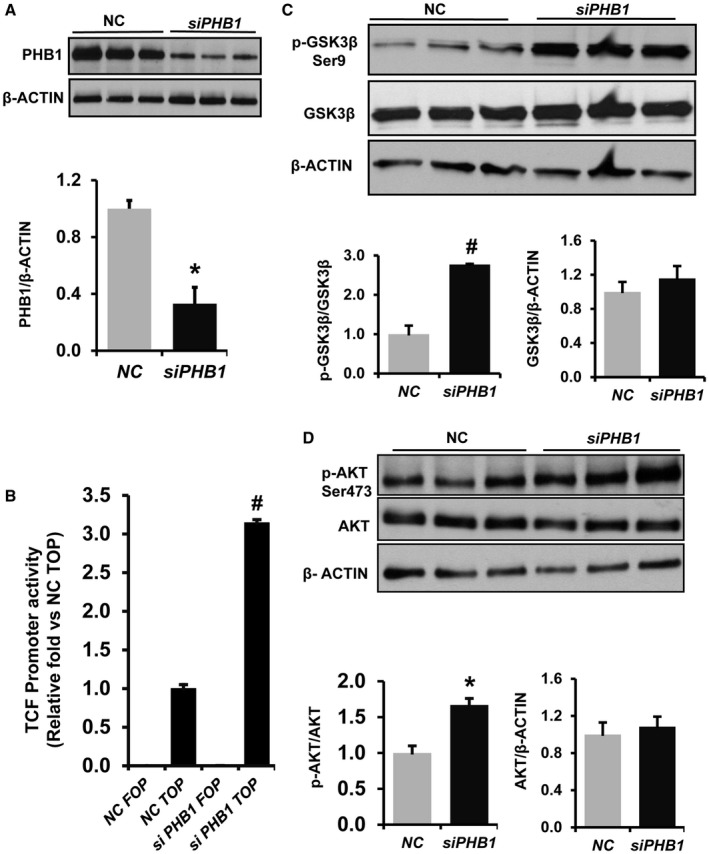
Figure 4.

Effect of PHB1 silencing on WNT signaling in HepG2 cells. HepG2 cells were forward transfected with PHB1 siRNA or NC. (A) Total protein was prepared from transfected cells, and western blot was performed for PHB1 and beta‐ACTIN. The graph below represents the densitometry quantification of PHB1 expression level normalized to beta‐ACTIN. Results represent mean ± SEM; n = 3; *P < 0.05 versus NC. (B) PHB1 was silenced in HepG2 cells for 24 hours and cotransfected with a TCF TOPFlash reporter or its mutant FOPFlash plasmid for an additional 24 hours. Luciferase activity was measured using the Promega luciferase assay kit and normalized to Renilla luciferase activity; fold increase in promoter activity is shown. Results represent mean ± SEM from three independent experiments performed in duplicates. #P < 0.005 versus NC TOPFlash. (C) Western blot analysis of pGSK3betaSer9, total GSK3beta, and beta‐ACTIN and (D) pAKTSer473, total AKT, and beta‐ACTIN in PHB1‐silenced HepG2 cells. Densitometry quantification of the protein band intensity was performed using ImageJ software (NIH). Ratios were calculated to determine fold induction and activation. Results represent mean ± SEM from three independent experiments; *P < 0.05 versus NC.
