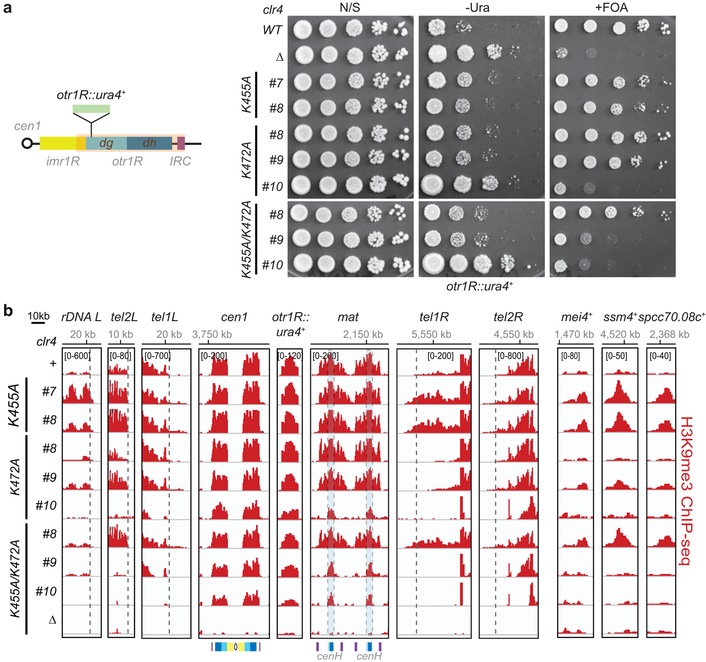
Extended Data Figure 6 ∣. Clr4 hyperactive mutants promote epigenetic instability.
a, Left, map of the right arm of centromere 1 (cen1) with the insertion of the ura4+ reporter gene at the pericentromeric otr1R repeat (otr1R::ura4+). Right, otr1R::ura4+ silencing assay in the indicated genotypes showing clone to clone variation of ura4+ silencing in clr4 hyperactive mutants. N/S, nonselective medium; −Ura, minus uracil medium; +FOA, 5-FOA-containing medium. Experiment performed twice with similar results with two to three independent clones as shown. b, H3K9me3 ChIP-seq reads mapped to different heterochromatin regions (left) or euchromatic genes (right) in the indicated genotypes are presented as reads per million (number in bracket in the first row of each ChIP-seq data) and highlight increased or decreased spreading of H3K9me2 or me3 in Clr4-K455 mutants. S. pombe h+ cells used for the ChIP-seq experiments have a duplicated mat locus. Top, chromosome coordinates. See Fig. 3 legend for abbreviations. Sequencing performed once with two to three independent clones as shown.

