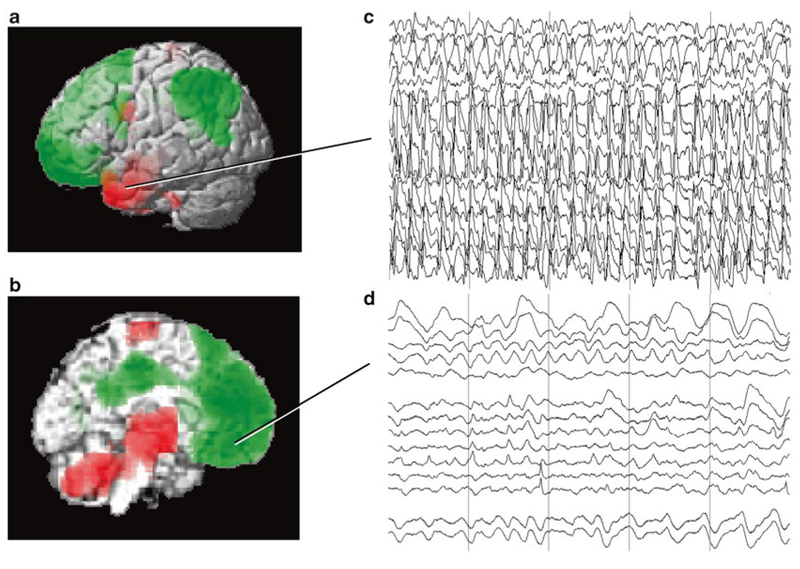
Fig. 5.1. Local and long-range network effects in temporal lobe complex partial seizures.
(a, b) Group analysis of SPECT ictal-interictal difference imaging during temporal lobe seizures. CBF increases (red) are present in the temporal lobe (a) and in the medial thalamus (b). Decreases (green) are seen in the lateral frontoparietal association cortex (a) and in the interhemispheric frontoparietal regions (b). (c, d) Intracranial EEG recordings from a patient during a temporal lobe seizure. High frequency polyspike-and-wave seizure activity is seen in the temporal lobe (c). The orbital and medial frontal cortex (and other regions, EEG not shown) do not show polyspike activity, but instead large-amplitude, irregular slow rhythms resembling coma or sleep (d). Vertical lines in (c) and (d) denote 1-s intervals. Note that the EEG and SPECT data were from similar patients, but were not simultaneous, and are shown together here for illustrative purposes only ((a, b) Modified from Blumenfeld et al. [2] with permission. (c, d) Modified from Englot et al. [3] with permission)

