CORRIGENDUM FOR 10.1210/jc.2012-1444
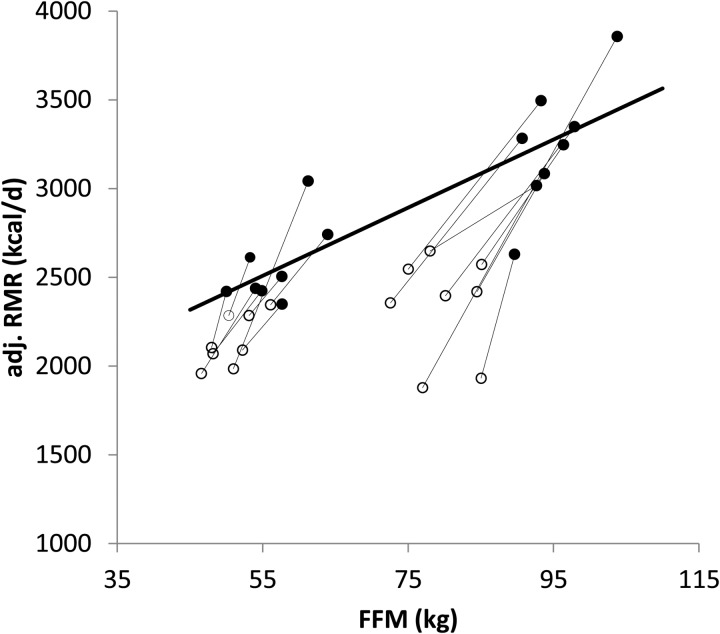
In the article “Metabolic Slowing With Massive Weight Loss Despite Preservation of Fat-Free Mass ” by Johannsen DL, Knuth ND, Huizenga R, Rood JC, Ravussin E, Hall KD. (J Clin Endocrinol Metab. 2012;97(7):2489–2496; doi: 10.1210/jc.2012-1444), the authors report the following error in the published paper: We recently identified an error in the week 30 resting metabolic rate (RMR) data in the above manuscript. In Table 1, the RMR at week 30 in the full 16 subject sample was (mean ± SD) 2015 ± 332 kcal/d such that there was a decrease from baseline of 664 ± 469 kcal/d (P < .0001) with a significant metabolic adaptation of −370 ± 290 kcal/d (P < .0001). Also in Table 1, the week 30 RMR of the 11 subjects completing measurements at 6 weeks was 1926 ± 328 kcal/d (P = .001 vs. baseline) and the metabolic adaptation of –345 ± 239 kcal/d (P = .0004) was no longer significantly different from week 6 (P = .082). Figure 2 has been corrected below.
Figure 2.
Resting metabolic rate (RMR) adjusted for sex, age and fat mass (adj.
RMR, kcal/d) at baseline (•) and week 30 (○) of the weight loss competition (n = 16). The regression line was derived from RMR measurements at baseline in all 16 participants. The deviation from the regression line at week 30 suggests that RMR per kg fat-free mass was reduced, indicative of metabolic adaptation.
In Figure 3, A, nonresting energy expenditure at week 30 was 1129 ± 399 kcal/d and significantly lower than baseline (P = .04). Physical activity at week 30 shown in Figure 3B was 4.4 ± 3.3 kcal/kg/d higher than baseline (P < .0001) and significantly lower than week 6 (P = .02). The previously reported correlation of metabolic adaptation with weight loss at week 30 remained significant (r = 0.56, P = .038) but the correlation with TSH change was no longer significant (r = 0.16, P = .61). The authors regret this error.


