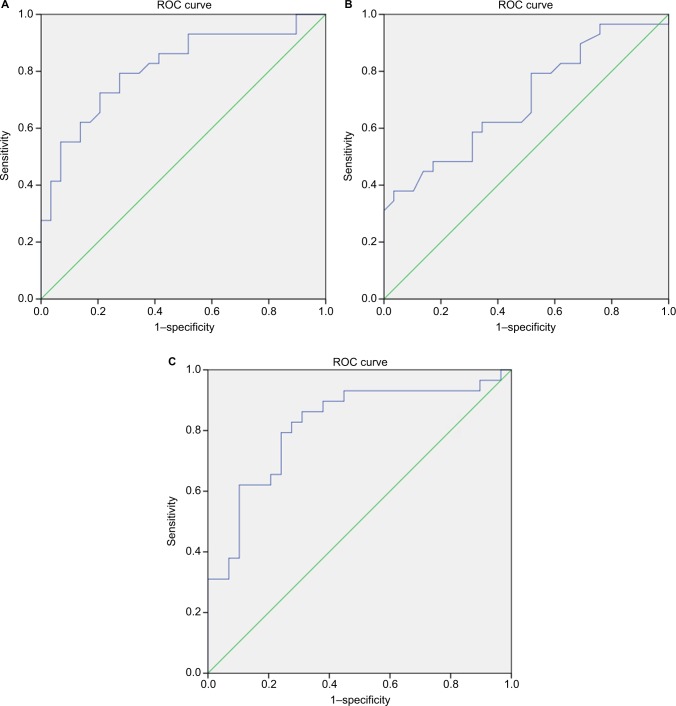
Figure 1.
The ROC curves for the optimal cutoff value of platelet indices.
Notes: (A) The ROC curve for PLT (larger values indicate infection). (B) The ROC curve for PDW (smaller values indicate infection). (C) The ROC curve for PDW in combination with PLT.
Abbreviations: PDW, platelet distribution width; PLT, platelet count; ROC, receiver operating characteristic.

