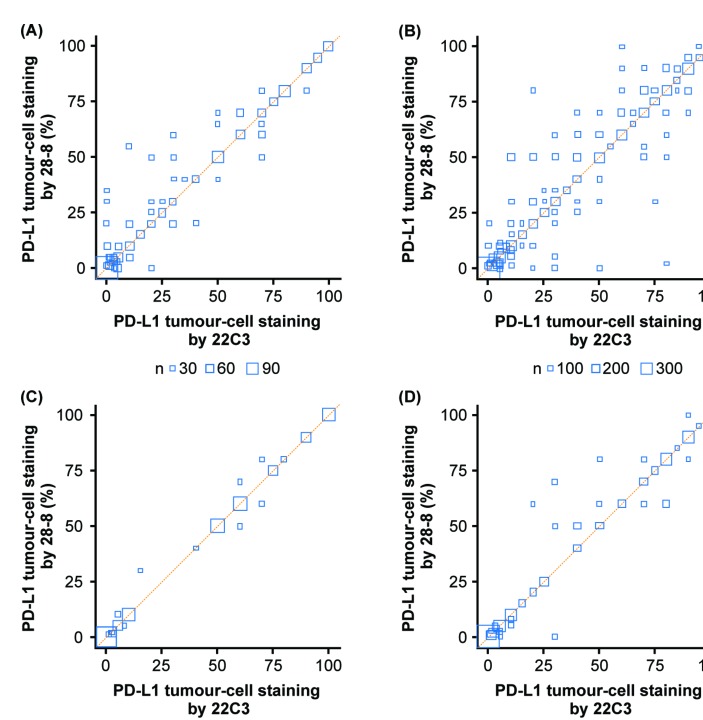
Figure 3.
Pairwise comparison for lung cancer or unspecified cancer diagnosis for most frequent biopsy sites (lung or lymph node). Bubble plot of matched tumour biopsies stained with PD-L1 immunohistochemistry 28-8 and 22C3 assays against the line of agreement (orange). (A) Lung cancer diagnosis, lung biopsy site, n=275. (B) Unspecified cancer diagnosis, lung biopsy site, n=804. (C) Lung cancer diagnosis, lymph node biopsy site, n=44. (D) Unspecified cancer diagnosis, lymph node biopsy site, n=162. Node size is proportional to the number of observations with the same 22C3 and 28-8 expression values. PD-L1, programmed death ligand 1.

