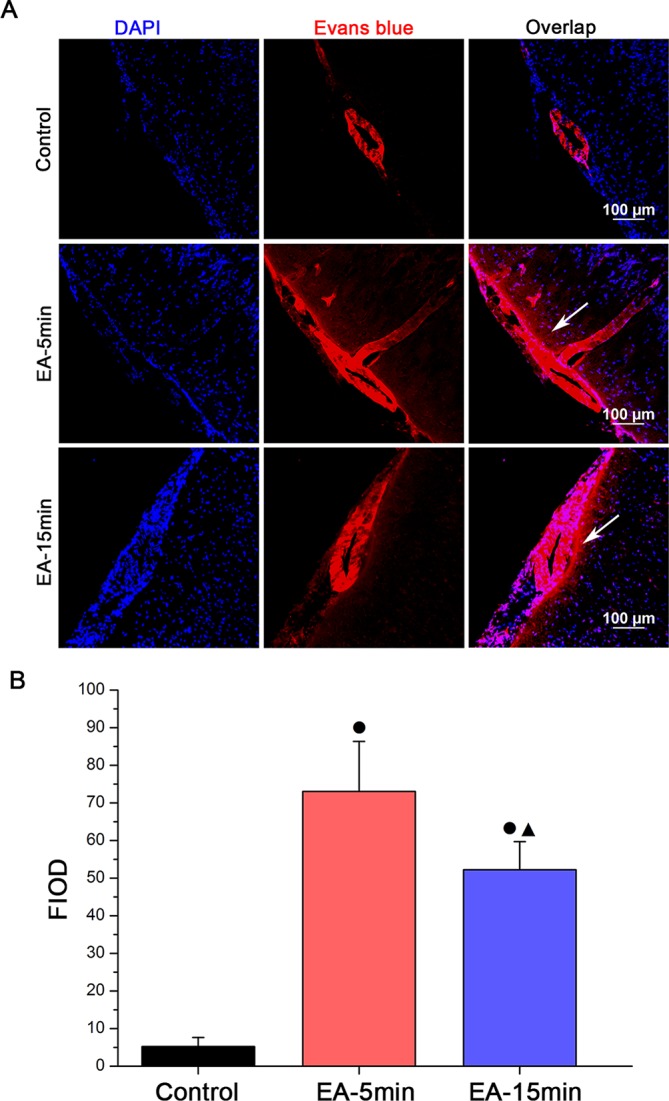
Figure 4.

Representative images (A; scale bar 100 µm) and quantification (B) by group of Evans blue fluorescence integrated optical density (FIOD) levels (detected by immunofluorescence staining) in cerebral cortex sections from a subset of 15 healthy Sprague-Dawley rats that remained untreated (control group, n=5) or received electroacupuncture (EA) treatment for 5 or 15 minutes (EA-5min group and EA-15min group, respectively, n=5 each). Data are expressed as mean±SEM. ●P<0.01 versus control group, ▲P<0.01 versus EA-5 min group (4B). DAPI, 4', 6-diamidino-2-phenylindole.
