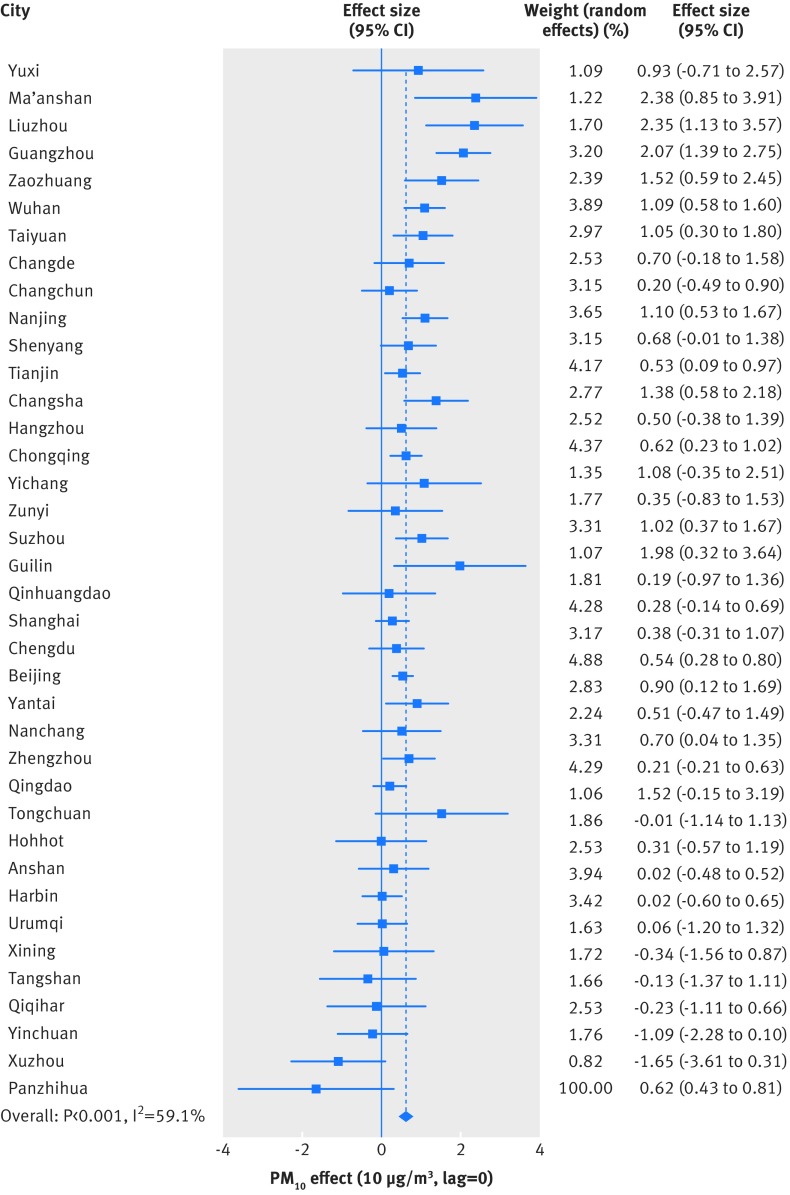
Fig 4 Maximum likelihood estimates (percentage) and 95% confidence intervals of the impact of 10 µg/m3 PM10 (lag=0) on total mortality for deaths due to cardiorespiratory diseases in 38 large cities in China. The dependent variable is the percentage change in number of daily deaths due to cardiorespiratory diseases. Each solid square represents an effect size. Horizontal lines indicate 95% confidence intervals

An official website of the United States government
Here's how you know
Official websites use .gov
A
.gov website belongs to an official
government organization in the United States.
Secure .gov websites use HTTPS
A lock (
) or https:// means you've safely
connected to the .gov website. Share sensitive
information only on official, secure websites.
