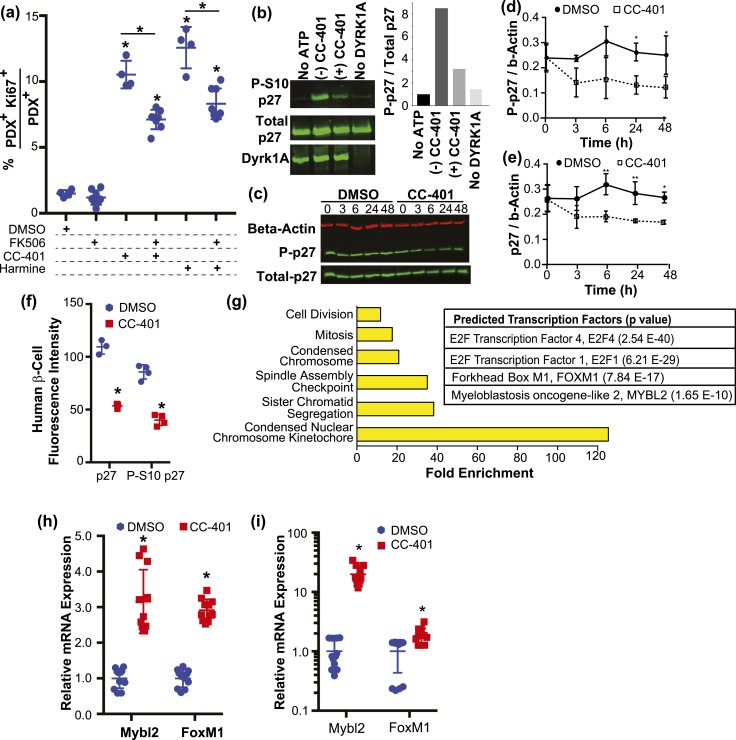
Figure 5.
Inhibition of DYRK1A/B promotes β-cell replication via NFAT activation, p27kip1 destabilization, and DREAM-complex target gene derepression. (a) In vitro rat β-cell–replication indices after compound treatment as indicated. The results from individual wells (n = 4 to 7) are shown with mean ± standard deviation (SD). *P < 0.05 vs the DMSO-treated condition or as indicated. (b) Western blot analysis of phospho-S10p27, p27, and DYRK1A after in vitro incubation of recombinant p27 and DYRK1A with and without adenosine triphosphate, CC-401, or DYRK1A. Quantitation of S10 phosphorylated p27 intensity normalized to total p27 are shown in the right-side panel. (c) Representative western blot of R7T1 β-cell lysates probed for β-actin, p27, and phosphoS10-p27 after treatment of cultures with DMSO or CC-401 for the indicated time (hours). Quantitation of the relative levels of (d) phosphoS10-p27 and (e) total p27 obtained from western blots (n = 3) performed as in (c). Protein levels were normalized to β-actin levels. *P < 0.05 vs DMSO condition at the relevant time point. (f) The average fluorescence intensity of p27 and phospho-S10p27 measured in β cells (PDX1+) from human islet cultures treated with DMSO or CC-401. Individual wells (n = 4; >1500 β cells per well) are shown with mean ± SD. *P < 0.01. (g) Enriched gene ontology categories (left) and transcription factor networks (right) identified by MetaCore analysis of differentially expressed genes from RNA sequencing performed on fluorescence-activated cell–sorted β cells after vehicle- and CC-401–treatment (48 hours); see Supplemental Table 4 for complete results. (h) Relative gene expression levels determined by qPCR (normalized to Gapdh) after treatment of growth-arrested R7T1 β-cell cultures with DMSO or CC-401 for 48 hours. (i) Relative gene expression levels determined by qPCR (normalized to GAPDH) after treatment of human islet cultures with DMSO or CC-401 for 48 hours. Error bars represent the standard deviation of an experimental condition (n ≥ 3). ATP, adenosine triphosphate.

