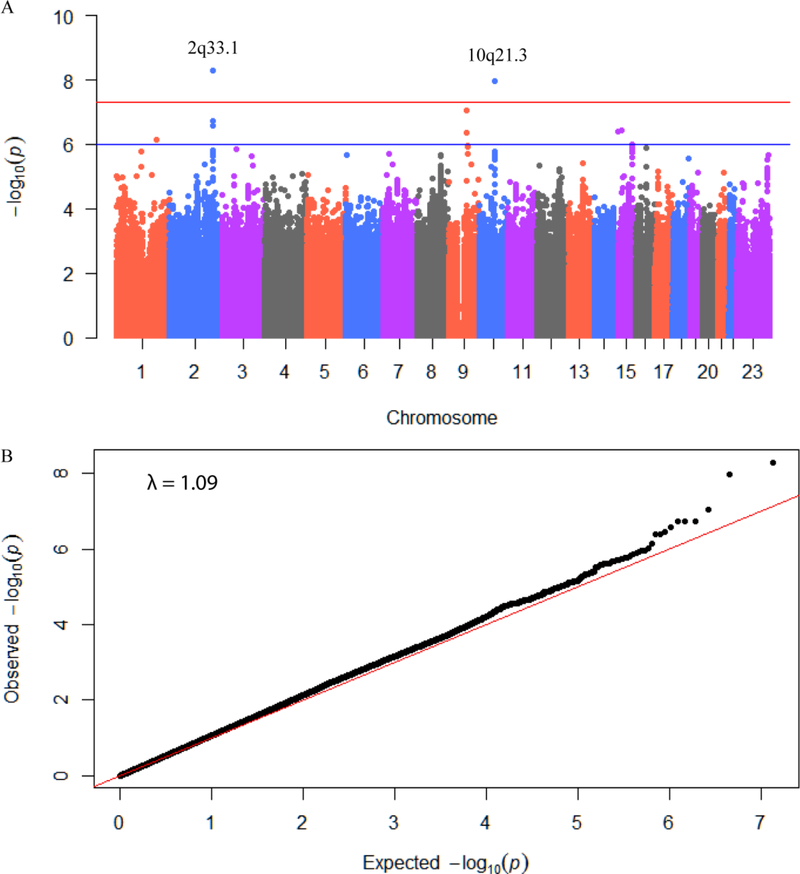
Figure 2.
Results from a GWAS of prostate cancer specific survival time in the MDC cohort. A: Manhattan plot of P values for each SNP highlighting key chromosomal regions. P values are for variant associations with prostate cancer survival time from Cox proportional hazard model, each adjusted for cancer diagnosis age, principal components and cancer stages at diagnosis. Horizontal red line indicates genome-wide statistical significance (P < 5 × 10⁻⁸) and blue line indicate suggestive significance (P < 1 × 10⁻⁵). B: Quantile-quantile (q-q) plot of GWAS results. Observed P value from association study for each SNP is plotted against expected P value from continuous uniform distribution.

