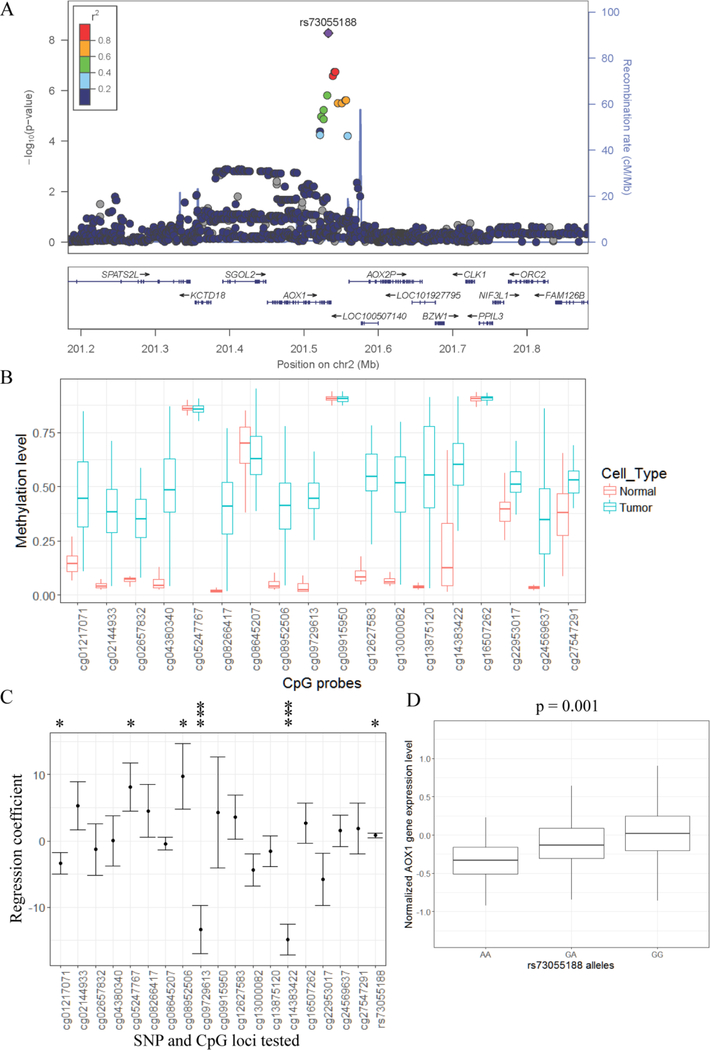
Figure 4.
Linear regression identifies that DNA methylation and rs73055188 are associated with AOX1 gene expression. A: Regional plot from GWAS in MDC cohort of the top risk SNP (rs73055188). Y-axes represent the statistical significance (−log10-transformed P values) of SNP association results (left) and the recombination rate (right). The color code for the points represents the r2 of each SNP with rs73055188 (ranges defined in the legend). Multiple risk SNPs with low P values are located in AOX1 gene. B: DNA hypermethylation is observed at multiple CpG sites near AOX1 gene in prostate tumor cells comparing with adjacent normal cells. TCGA data is used and CpG loci identification is from Illumina HumanMethylation450 BeadChip. C: Relationship between the expression of AOX1 gene and genotype of rs73055188 and DNA methylation levels at nearby CpG sites. Data from prostate tumors in TCGA is used. Y-axis is regression coefficient for each risk factor using multivariate linear regression model. Error bar shows standard deviation of regression coefficient. Statistical significance is labeled as * (P < 0.05) and *** (P < 0.0005). D: rs73055188 is associated with AOX1 expression in adjacent normal prostate tissue from prostate or bladder cancer patients. Box plot shows AOX1 expression level stratified by different genotypes at rs73055188. P value is calculated using fixed-effect association test.

