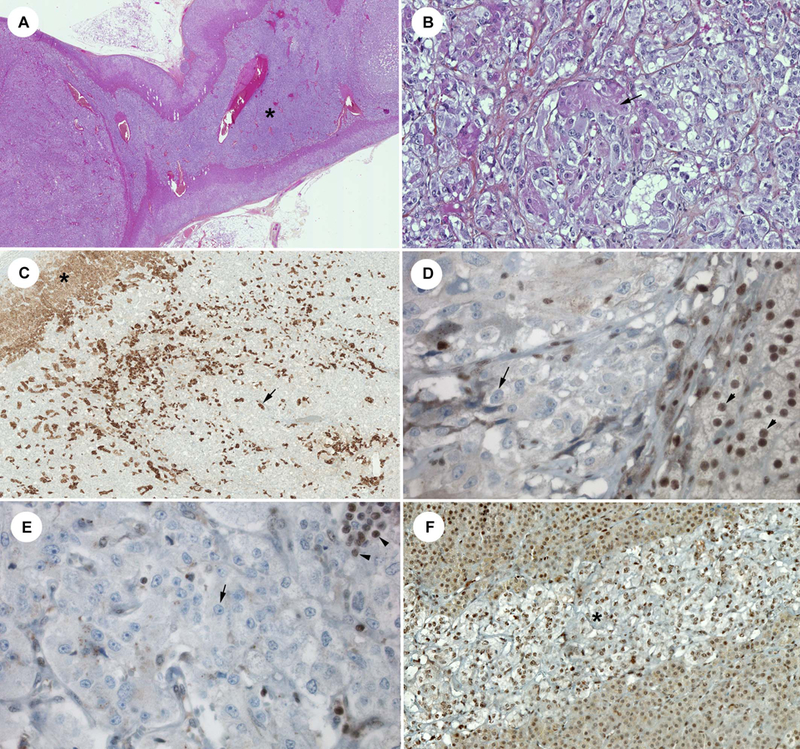
Figure 2. Pathological findings.

A: Hematoxylin-eosin-saffron staining (HES) showing centered over the left hyperplasia area (*), B: Left PHEO with cortical cells embedded in the tumor (arrow), C: LDL-R staining showing these cortical cells (arrow) (similar pattern than adrenal cortex : *). This finding may explained the increased % of WT alleles in this nodule, compared to other ones, D: protein MAX staining negative in the nodular AMH (arrow) (see the positive control in the cortex: arrowhead), E: protein MAX staining negative in the diffuse AMH area (arrow) (positive lymphocytes: arrowhead), F: protein MAX staining positive in an area of residual normal adrenal medulla (*).
