
Figure 3.
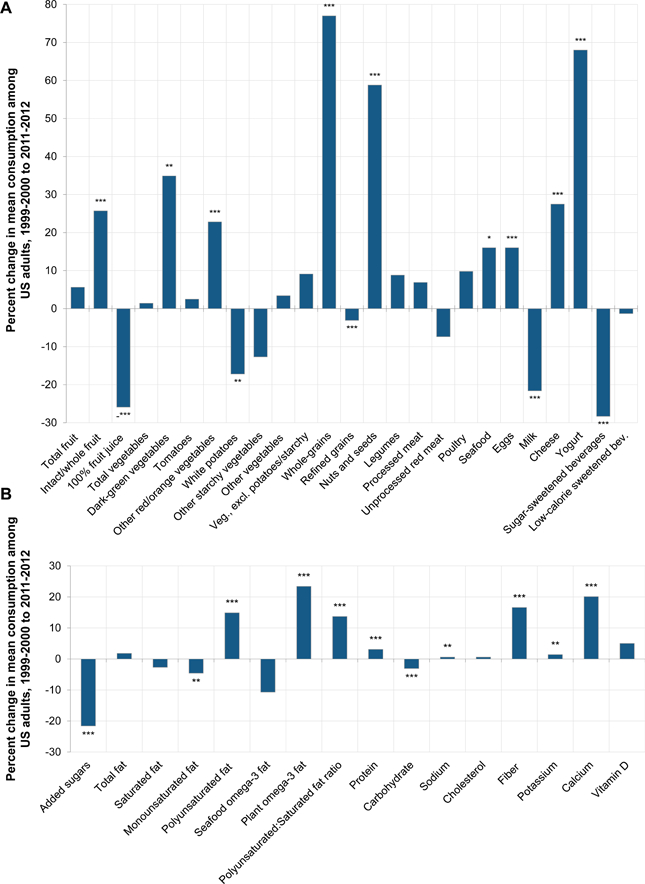
Percent change in intake of food groups (Panel A) and nutrients of interest (Panel B). Analyses are based on energy-adjusted values to 2000 kcal/d using the residual method. * p-trend<0.05; ** p-trend<0.01; *** p-trend<0.001
Official websites use .gov
A
.gov website belongs to an official
government organization in the United States.
Secure .gov websites use HTTPS
A lock (
) or https:// means you've safely
connected to the .gov website. Share sensitive
information only on official, secure websites.
Percent change in intake of food groups (Panel A) and nutrients of interest (Panel B). Analyses are based on energy-adjusted values to 2000 kcal/d using the residual method. * p-trend<0.05; ** p-trend<0.01; *** p-trend<0.001