
Figure 4.
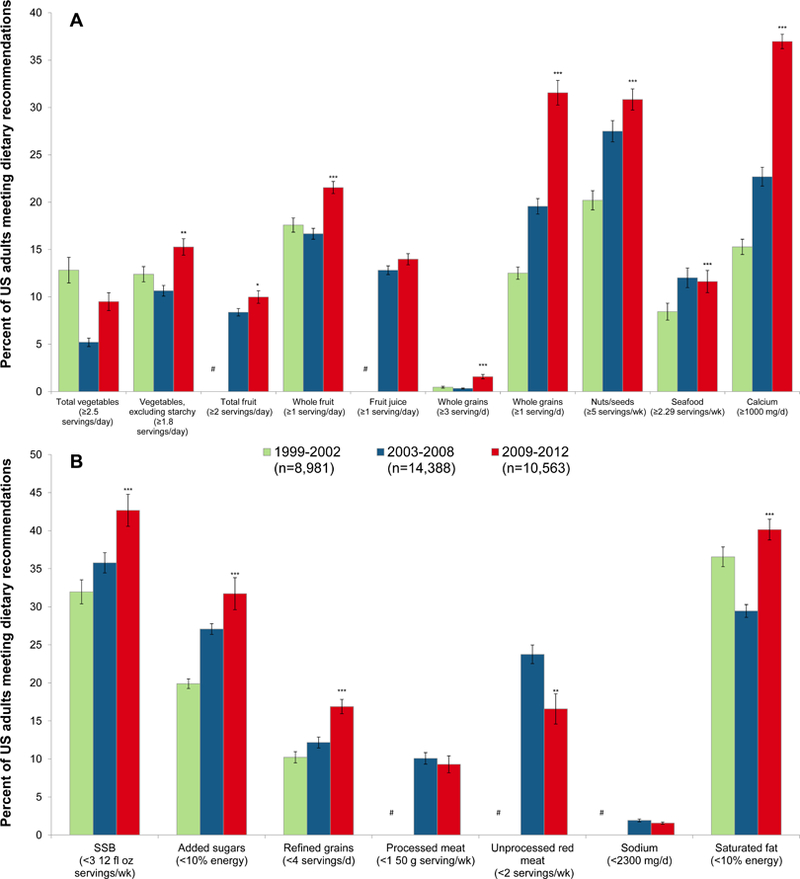
Trends in the proportion of US adults meeting dietary recommendations, based on NHANES data from 1999 to 2012. Recommendation levels are provided and are based on the 2015 Dietary Guidelines for Americans (for total vegetables, vegetables excluding starchy vegetables, total fruit, whole-grains, refined grains, nuts/seeds, seafood, calcium, added sugars, sodium and saturated fat; the American Heart Association 2020 Strategic Impact Goals (sugar-sweetened beverages; the Global Burden of Diseases study optimal intake levels (unprocessed red meat, processed meat); and pragmatic or alternative cutpoints (whole fruit, fruit juice, whole-grains [1+ serving]). Analyses are based on energy-adjusted values to 2000 kcal/d using the residual method. Serving sizes: fruits, vegetables: 1 cup; grains, nuts/seeds: 1-oz equivalents; meats, seafood: 3.5-oz equivalents. * p-trend<0.05; ** p-trend<0.01; *** p-trend<0.001; # 1999–2002 estimates could not be reliably imputed by the NCI method (see Supplemental Materials for details).