
Figure 5.
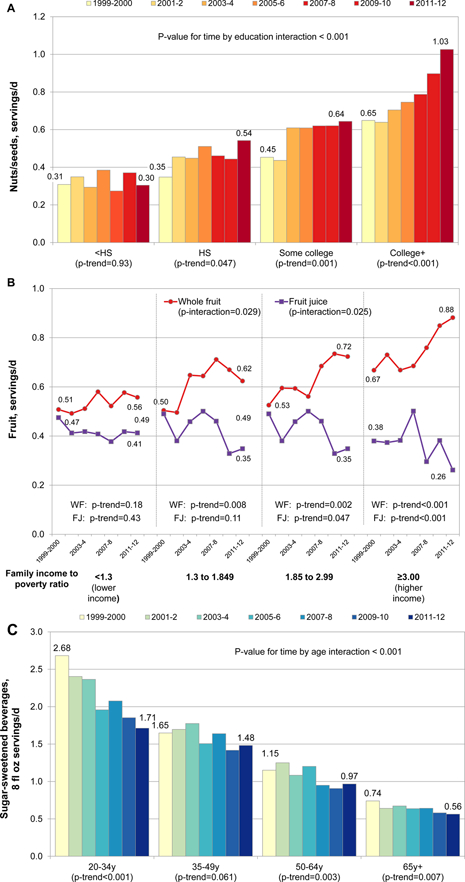
Trends in mean consumption of nuts/seeds by education (Panel A), fruit by family income (Panel B) and sugar-sweetened beverages by age (Panel C) among US adults, based on NHANES data from 1999 to 2012. All values are energy-adjusted to 2000 kcal/d using the residual method. Serving sizes: nuts/seeds: 1-oz equivalent; fruit: 1 cup; sugar-sweetened beverages: 8 fluid oz.