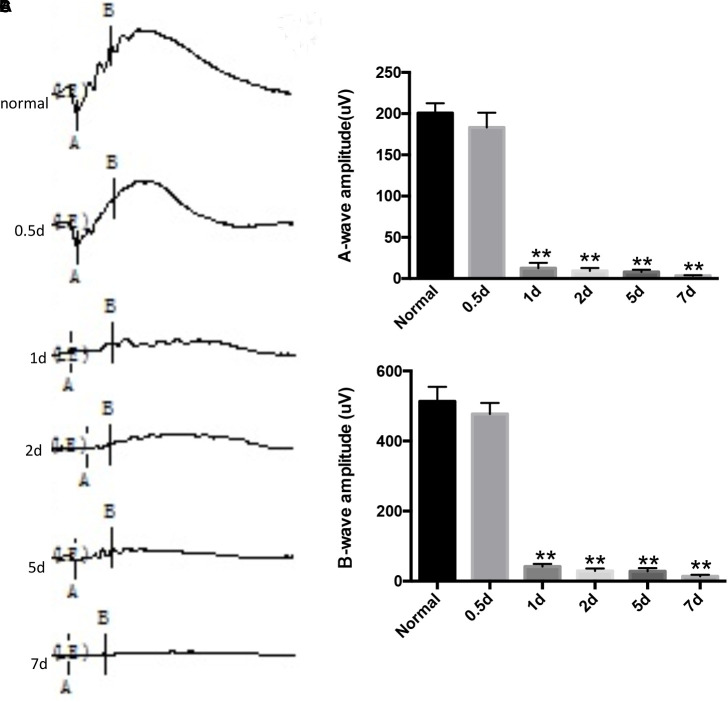
FIGURE 2.
N-methyl-N-nitrosourea (MNU)-induced retinal function alteration was evaluated by electroretinography (ERG) recordings. The representative ERG waveforms of the normal controls and the MNU-treated retinas at different recording time points and B wave marker position shown is not what was used for quantification in this graph. (A). After MNU administration, the amplitudes of both the a- and b-waves were significantly reduced compared to those of normal controls, as determined by Kruskal–Wallis ANOVA analysis followed by post-hoc testing (B,C); ∗∗p ≤ 0.01 for differences compared to normal controls.

