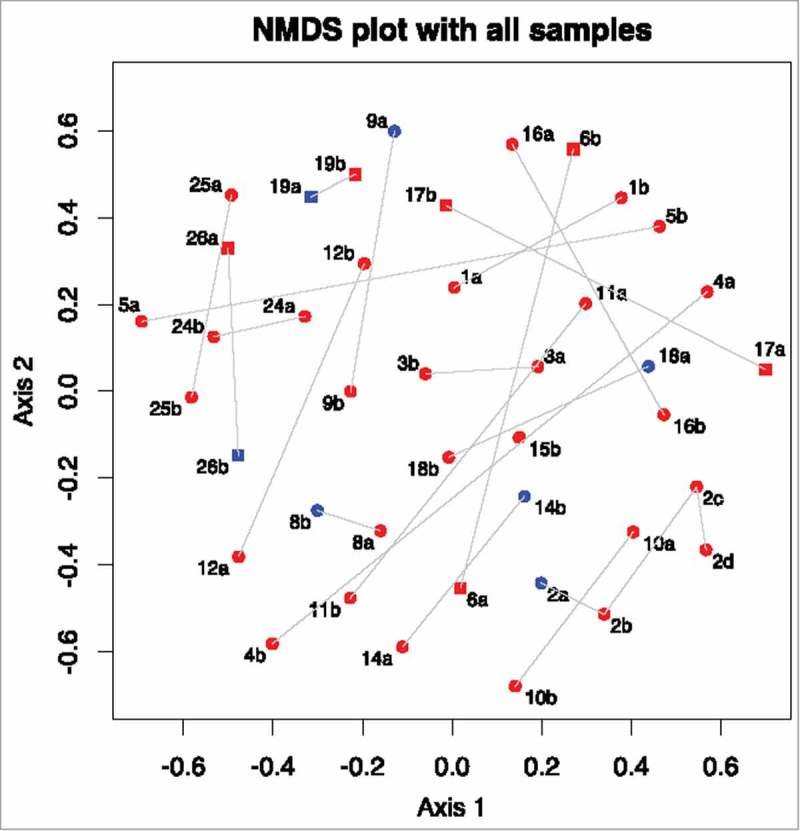
Figure 1.

Non-metric multi-dimensional scaling plot of Yue and Clayton theta distances between all samples. Numbers represent different patients. a represents a sample collected at the first time-point, b represents the second time-point, c at third time-point and d the fourth. Samples taken in the presence of active inflammation (histological or endoscopic) are coloured red, those with no inflammation are coloured blue. Samples from those with Crohn's disease are circles, samples from those with ulcerative colitis are squares.
