Figure 3.

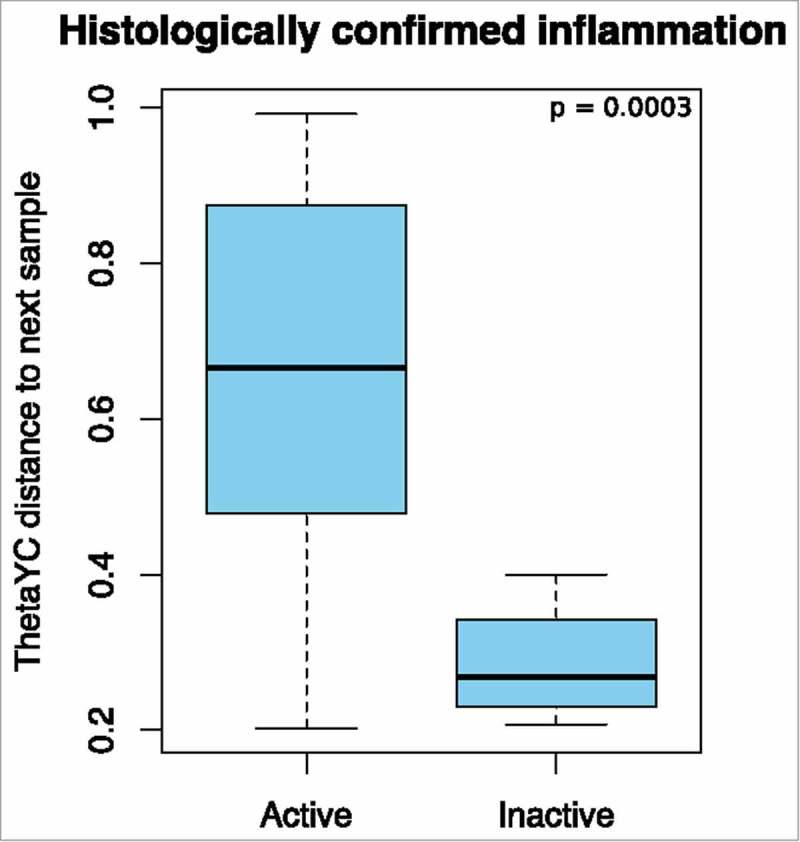
Beta diversity: Yue and Clayton theta distances between sample pairs. The presence (active, n = 29) or absence (inactive, n = 4) of histologically confirmed inflammation and the distance to the next sample.

Beta diversity: Yue and Clayton theta distances between sample pairs. The presence (active, n = 29) or absence (inactive, n = 4) of histologically confirmed inflammation and the distance to the next sample.