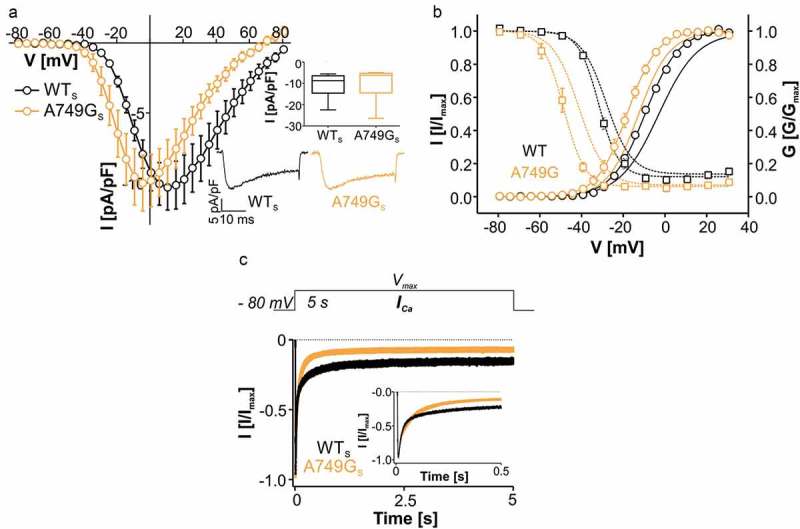
Figure 2.

Biophysical properties of Cav1.3 mutant A749GS. (a) Current-voltage relationships (ICa, mean ± S.E.M.; 50-ms depolarizations to indicated voltages) of WTS and A749GS. Only WT data recorded in parallel on the same days (> 3- different transfections) were included. Inset (upper): Box plots of WTS and A749GS peak current densities. In contrast to the long splice variant, no significant difference was observed in the current amplitudes (median, 5/95 percentile, [pA/pF]): WTS: −8.74 (−22.4/-5.54) n = 10; A749GS: −6.18 (−26.4/-4.94), n = 12; p = 0.339, Mann Whitney test). Inset (lower): Representative ICa traces from WTS and A749GS during depolarizations to Vmax. (b) Steady-state activation (circles, solid lines) and inactivation (squares, dashed lines) of WTS (black symbols) and A749GS (orange symbols). For statistics and n-numbers see Table 1. Lines without symbols represent the corresponding voltage-dependence of activation and inactivation for full length WTL and A749GL recorded under identical conditions (taken from reference 10). (c) Inactivation time course of WTS (n = 35) and A749GS (n = 9) during depolarization to Vmax for 5 s. Normalized traces are shown as mean ± S.E.M. Inactivation was best described by a bi-exponential decay. The faster inactivation of the mutant resulted from a slightly larger contribution of the fast inactivating component (WTS: 79.1 ± 1.11 %, n = 26, A749GS: 84.3 ± 2.21 %, p = 0.036, n = 8) and faster inactivation of the slow component (WTS: τslow = 602 ± 21.8 ms, A749GS: 420 ± 59.6 ms, p = 0.0012), despite a moderately slower fast inactivation (WTS: τfast = 36.5 ± 1.8 ms, A749GS: 57.9 ± 7.99 ms, p = 0.0004). Additionally, inactivation was more complete in the mutant (remaining current: WTS: 14.6 ± 2.5 %, A749GS: 5.65 ± 1.19 %, p = 0.061, for statistics see Table 2). Statistical significance has been determined by unpaired Student’s t-test.
