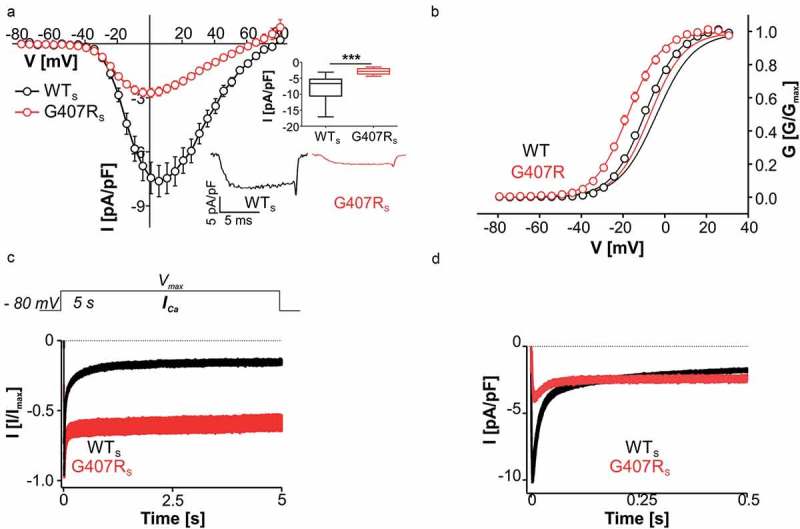
Figure 3.

Biophysical properties of Cav1.3 mutant G407RS. (a) Current-voltage relationships (ICa, mean ± S.E.M.) from WTS and G407RS recorded in parallel on the same days (>3-different transfections). Inset (upper): Box plots showing significantly reduced peak current densities for G407RS (median (5/95 percentile) [pA/pF]: WTS: −6.68 (−17.1/-3.09), n = 17; G407RS: −2.82 (−4.36/-1.46), n = 13; *** p < 0.0001, Mann Whitney test). Inset (lower): Representative ICa traces of WTS and G407RS upon depolarization to Vmax. (b) Voltage dependence of WT (black circles) and G407RS (red circles) activation. Lines without symbols depict the corresponding voltage-dependence of activation for full length WTL (black) and G407RL (red) recorded under identical conditions (taken from reference 10). Statistics for gating parameters are given in Table 1. (c) Normalized inactivation time course of ICa after 5-s depolarization to Vmax (mean ± S.E.M.). The fast inactivating component is reduced in G407RS (n = 8) as compared to WT (n = 35) leading to slower inactivation of the mutant (for statistics see Table 2). (d) Although G407RS maximal current density is significantly smaller than WTS, absolute G407RS current is larger than WTS after about 200 ms.
