Figure 4.

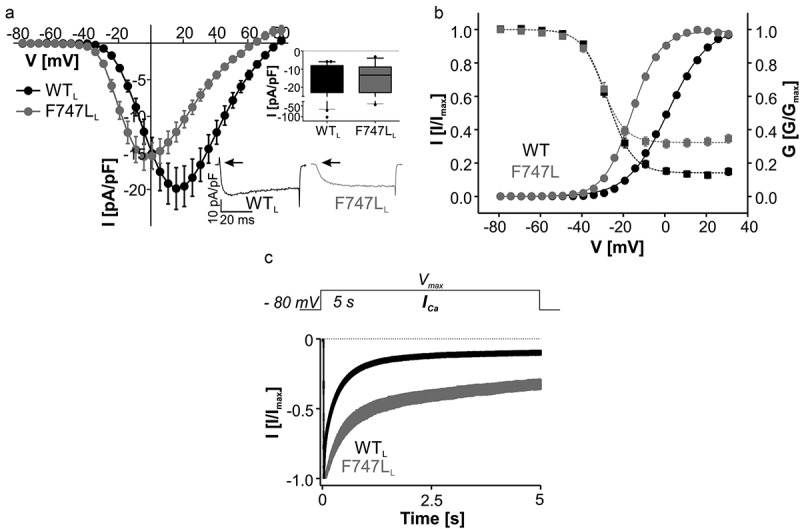
Biophysical properties of Cav1.3 mutant F747LL. (a) Current-voltage relationships (ICa, mean ± S.E.M.) of WTL and F747LL recorded in parallel on the same days (>3-different transfections). Inset (upper): Box plots of peak current densities (median, 5/95 percentile, [pA/pF]): WTL: −12.7 (−66.1/-5.96), n = 47; F747LL: −13.3 (−40.3/-3.97), n = 27). Black circles represent extreme values. Peak values were not statistically different (Mann Whitney test, p = 0.97). Inset (lower): Representative ICa traces of WTL and F747LL upon depolarization to Vmax. Note the slower activation time course and the absence of QON gating charge in F747LL (arrows). (b) Steady-state activation (circles, solid lines) and inactivation (squares, dashed lines) of WTL (black symbols) and F747LL (gray symbols). Gating parameters and statistics are given in Table 3. (c) Normalized inactivation time course of ICa after 5-s depolarization to Vmax (mean ± S.E.M.) illustrating pronounced slowing of inactivation by F747L.(n = 10) as compared to WTL (n = 28). For statistics, see Table 4.
