Figure 4.

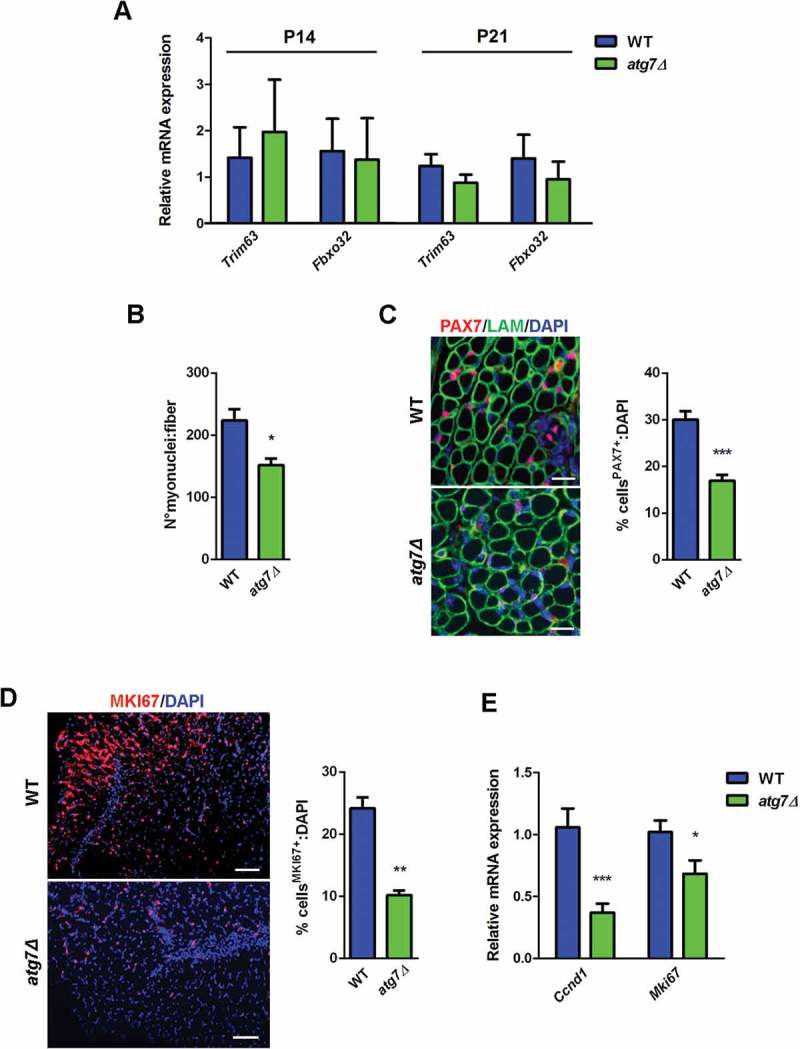
Defective autophagy negatively affects neonatal myogenesis in vivo. (a) RT-qPCR analysis of atrogenes Trim63 and Fbxo32 in GC of WT and atg7Δ mice at P14 and P21 (n ≥ 3 per genotype). (b) Mean number of myonuclei in single fibers from WT and atg7Δ mice at P21 (n ≥ 4 per genotype). (c) PAX7 immunostaining (red). Percentage of PAX7+ cells on total DAPI nuclear counterstaining (blue) is provided. LAM/laminin is used as a fiber outline (green) (scale bar: 20 µm) (n ≥ 3 per genotype). (d) MKI67 immunostaining (red). Percentage of MKI67+ cells on total DAPI nuclear counterstaining (blue) is provided (scale bar: 50 µm) (n = 3 per genotype). (e) RT-qPCR analysis of proliferation-related genes Ccnd1 and Mki67 in GC of WT and atg7Δ mice at P21 (n ≥ 5 per genotype). Values are expressed as mean ± SEM. * vs WT (* P < 0.05, ** P < 0.01, *** P < 0.001).
