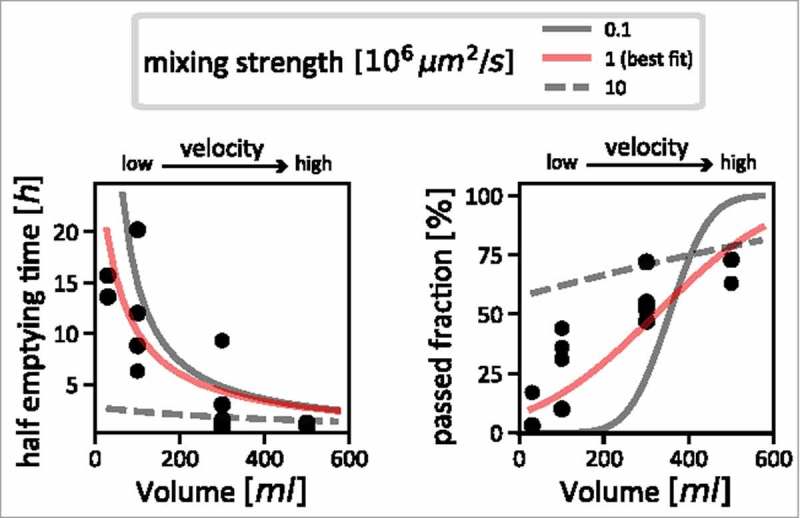
Figure 2.

Estimating the strength of mixing in the colon. Measurements taken by Hammer and Phillips28 (black dots) are shown, together with simulation results with varying mixing strengths. We used the comparison between simulations and the measured data to estimate the actual strength of mixing in the human colon. The left panel shows the relation between inflow volume (flow velocity) and half-emptying time of content from the proximal colon; very strong mixing can be ruled out, as for slow flow velocities, it would lead to much lower half emptying times (dashed grey line) than are supported by the data (black dots). The right panel shows the relationship between inflow volume (flow velocity) with the fraction of particles that has passed the ascending colon after 4 hours. Using this data, we can rule out very weak mixing: with increasing flow velocity, one would observe a sharp jump from a regime where no particles have passed for low velocities to a regime where almost all particles have passed (solid grey line). This is also not supported by the data, which describes a much smoother dependence on flow velocity (black dots). Our best estimate for mixing strength that consolidates these two sets of data is shown as red curves in both panels.
