
Figure 2.
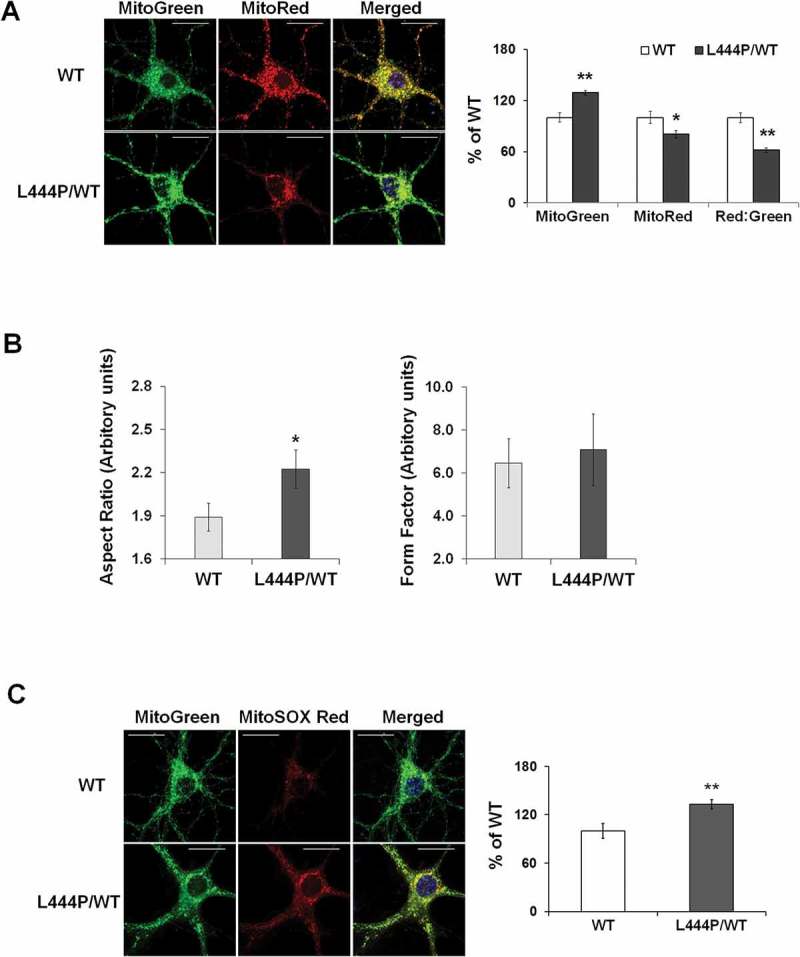
Mitochondrial dysfunction in GbaL444P/WT mouse hippocampal neurons (A) Representative micrographs of MitoTracker Red- and MitoTracker Green-labeled WT and GbaL444P/WT primary hippocampal neurons in primary cultures (14–15 DIV). DNA stained with Hoechst 33342 (1 μg/μl, blue) did not show nuclear condensation/fragmentation (left panel). The fluorescence intensities of MitoTracker Red and MitoTracker Green were quantified and the red:green ratio was calculated to estimate normalized MMP (right panel) (n ≥ 40 neuronal soma per condition from 4–5 cultures). Scale bar: 10 μm. (B) Mitochondrial morphology in control and GbaL444P/WT mutant neurons. The aspect ratio (left panel) is a measure of mitochondrial length, which is increased with the GBAL444P mutation. There were no differences in the form factor (right panel), which indicates the degree of mitochondrial branching. (C) Representative micrographs (left panel) and quantification (right panel) of MitoSOX Red-labeled WT and GbaL444P/WT mutant primary hippocampal neuronal cultures. Scale bar: 10 μm. For all measurements, >40 individual neurons were imaged per genotype from 4–5 culture dishes (8–10 neurons per dish). Blue, Hochest 33342 nuclei stain. Data are presented as mean % of WT controls ± SE. Compared to WT, * p < 0.05; **, p < 0.01, Student’s t-test.