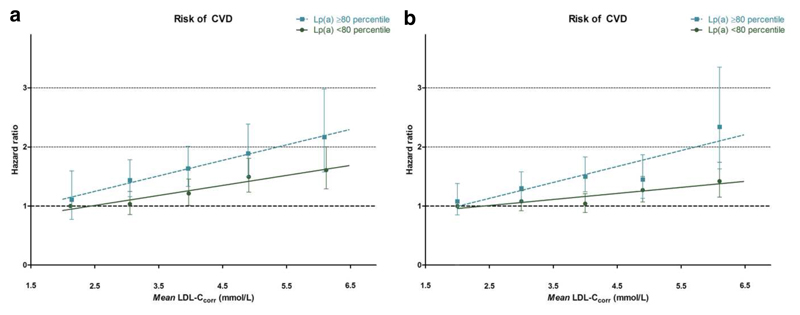
Figure 1.
a. EPIC-Norfolk prospective population study: CVD risk as a function of LDL-Ccorr and Lp(a)
b. Copenhagen City Heart Study prospective population study: CVD risk as a function of LDL-Ccorr and Lp(a)
Data are presented as age-, sex-, smoking-, body mass index-, diabetes mellitus-, glomerular filtration rate (GFR) and systolic blood pressure adjusted hazard ratios with corresponding 95% confidence intervals and mean LDL-Ccorr levels (mmol/L). Trend lines were constructed based on the mean LDL-Ccorr levels for each category. LDL-Ccorr =low density lipoprotein cholesterol corrected for Lp(a) derived cholesterol, Lp(a)=lipoprotein(a).

