
Figure 1.
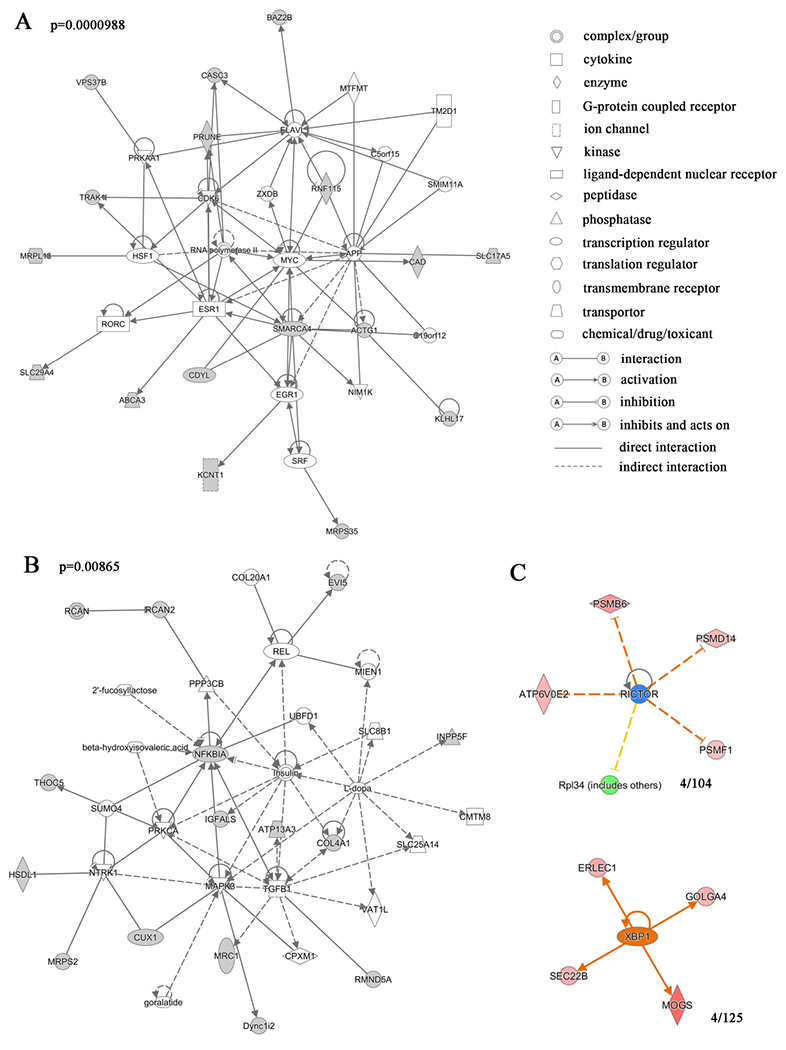
(A, B) Gene network analysis of the proteins differentially expressed in w1118 and ClkJrk flies revealed that these proteins are involved in the RNA polymerase II complex, transcription activator BRG1 and MYC-centered gene expression and transcriptional regulation network, and MAPK3 and insulin-like receptor-centered network of tissue development and metabolism. Variation coefficient > 0.6 and p value <0.05. The proteins shaded were presented in the differentially expressed proteins. The p value of the gene network was 0.0000988 for figure 1A and 0.00865 for figure 1B. The statistical information for the other gene networks identified is in Table S1. (C) Transcription factors that may regulate expression of differentially expressed proteins. 4/104 and 4/125 proteins were found to have common upstream factors XBP1 and RICTOR, respectively. The red to pink colors indicate up-regulation, and greens indicate downregulation. Darker colors indicate more extreme up or down regulation. Yellow indicates predicted activation, and blue predicted inhibition with darker hue indicative of more confidence in the prediction. Gray line indicates that effects are not predicted. Different types of the molecules are indicated by shapes as shown.