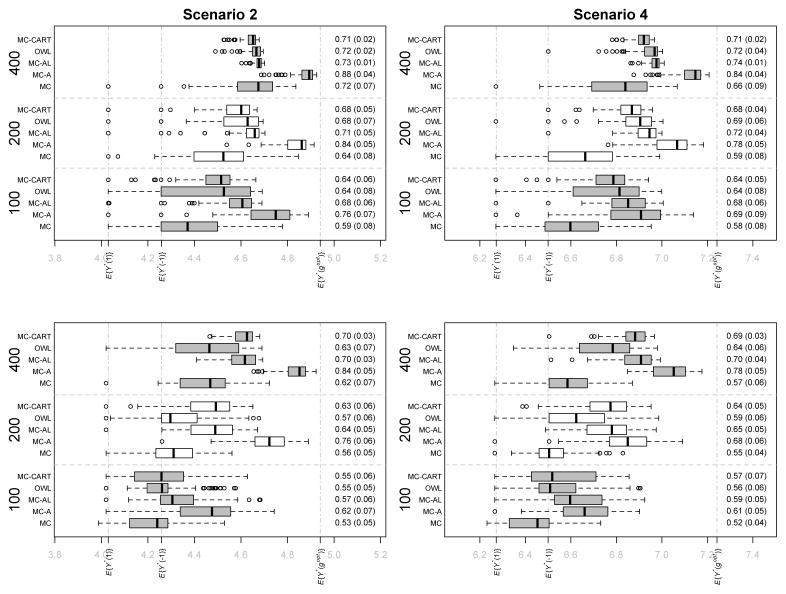
Fig. 3.
Simulation Set B (with error in functional predictors) Scenarios 2 and 4. Boxplots of expected values of response in test sets under estimated optimal regime for the 100 experiments in each setting. First Row Settings with p = 5, q = 3. Second Row Settings with p = 100, q = 10. Sample sizes and treatment regime estimation methods are on the vertical axis. Expected values of the decision rule is on the horizontal axis with E{Y*(−1)},E{Y *(1)}, and E{Y*(gopt)} marked. Mean (sd) PCD for each method and sample size combination shown on the right of each plot.

