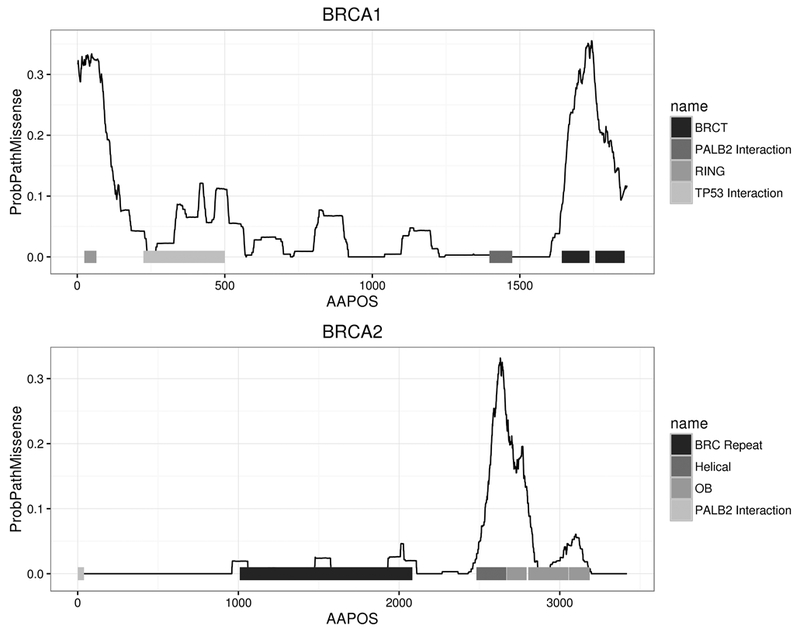
Figure 3. Estimates of the proportion of damaging missense variants by position in each gene.

The AAPOS x-axis represents the amino acid position, and the y-axis is the probability of a missense mutation being damaging from the NVM model. The lines were smoothed using a 50 amino acid sliding window.
