
Figure 4.
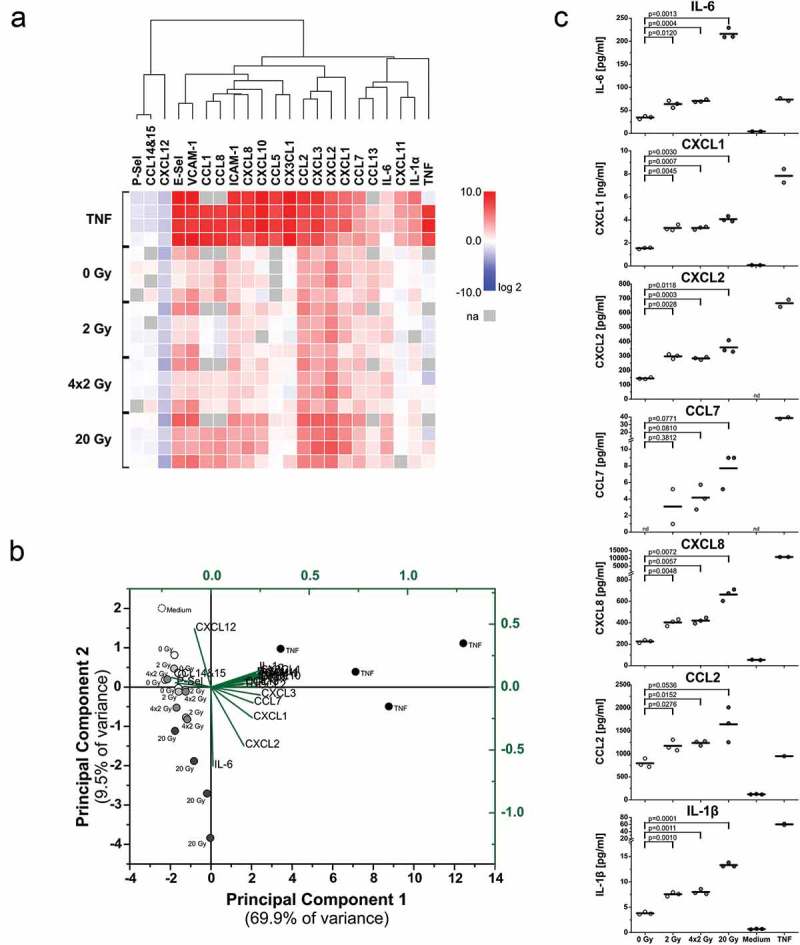
Upregulation of cytokines and chemokines in endothelial cells upon exposure to supernatants of irradiated tumor cells. (a) mRNA expression levels of crucial adhesion molecules, cytokines, and chemokines. HUVECs were incubated with supernatants of irradiated HCC1937 cells for 4 h as in Figure 3. mRNA expression levels were determined by qRT-PCR, normalized on a reference gene matrix of 18S rRNA, β2-microglobulin, and δ-ALAS, and calibrated on the respective medium-treated samples. TNF (50 ng/ml) served as positive control. Unsupervised hierarchical clustering of log2 expression values of 4 independent experiments is depicted (na indicates not assessed). (b) Principal component analysis (PCA) of mRNA expression data from (a). The biplot shows the scores of the samples (black coordinate system) and the scaled loadings of the input variables (green coordinate system) in the subspace of the first two principal components. (c) Cytokines and chemokines released from HUVECs were measured by multiplex-ELISAs after exposure to supernatants of irradiated HCC1937 cells for 4 h and incubation in fresh medium for two more hours. Concentrations were calculated on the basis of standard curves. n = 3 independent experiments are shown (nd indicates not detectable), and p-values were determined by unpaired Student’s t-tests with Bonferroni-Holm correction.