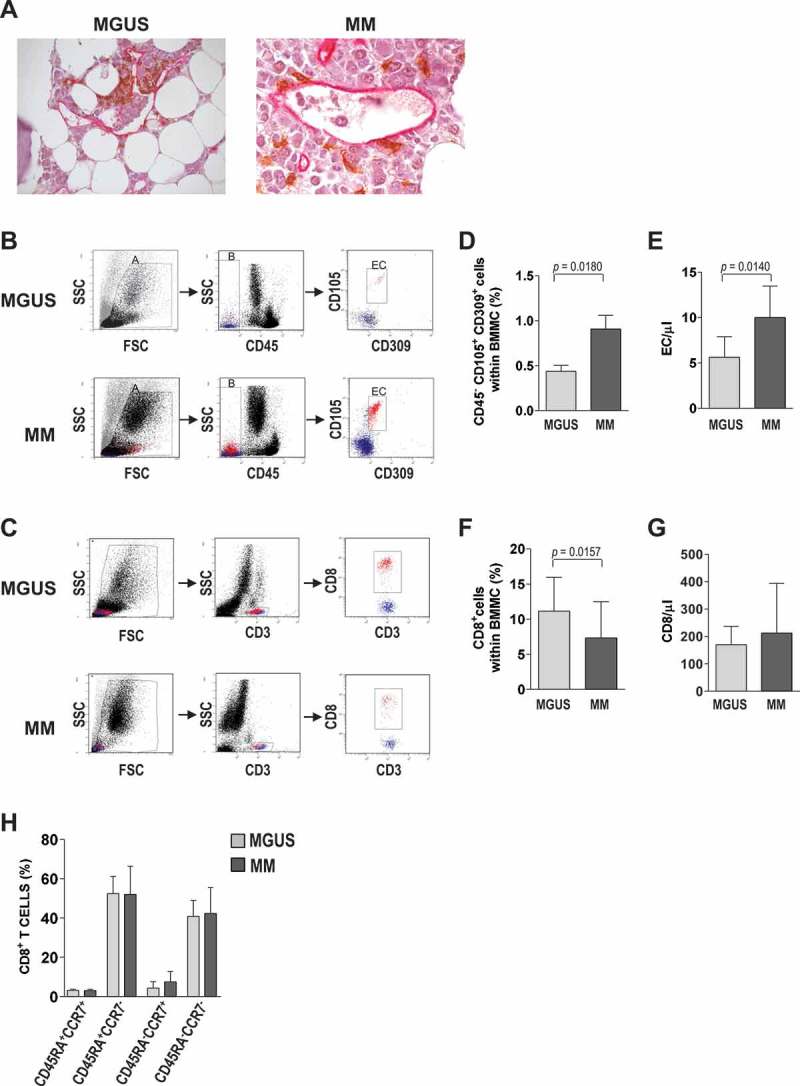
Figure 1.

EC and CD8+ T cells in bone marrow. (A) Representative photomicrographs of bone marrow biopsies from MGUS and MM patients stained for CD8 (brown) and CD34 (pink). (B-G) Frequency of EC and CD8+ T cells in bone marrow samples from 20 MGUS and 20 MM patients. (B,C) Flow cytometry strategies: gating was done sequentially on live cells, on CD45− cells, and then on CD105+CD309+ cells to identify EC (B), or it was done on live cells, on CD3+ cells, and then on CD8+ cells to identify CD8+ T cells (C). Representative plots from one patient for each group. (D-E) EC cells expressed as percentages (D) and in absolute numbers (E). (F-G) CD8+ T cells expressed as percentages (F) and in absolute numbers (G). (H) Memory markers of CD8+ T cells, expressed as percentages of cells expressing CD45RA and CCR7 assessed by flow cytometry. Bar graphs show means and standard deviations. Mann-Whitney test.
