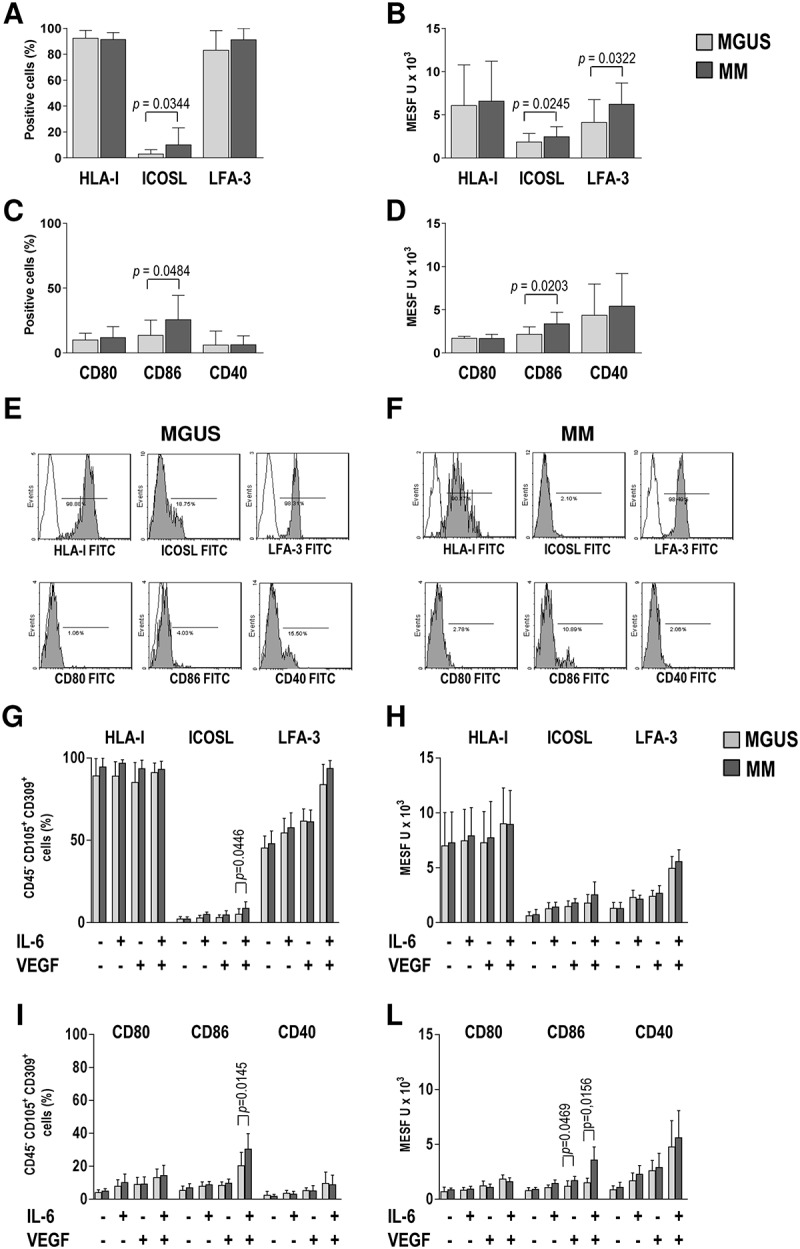
Figure 2.

Surface phenotype of bone marrow EC. (A,C) Percentages and (B,D) expression levels in positive cells reported in units of MESF. Mann-Whitney test. P-values are shown only for statistically significant comparisons. (E-F) Representative overlay plots show isotype control (white) and the expression of the indicated molecule (light gray) in (E) MGUS and (F) MM patients. (G,I) Percentages and (H,L) expression levels in positive cells reported in units of MESF of in vitro-expanded EC upon stimulation with IL-6, VEGF or both. Wilcoxon signed rank test.
