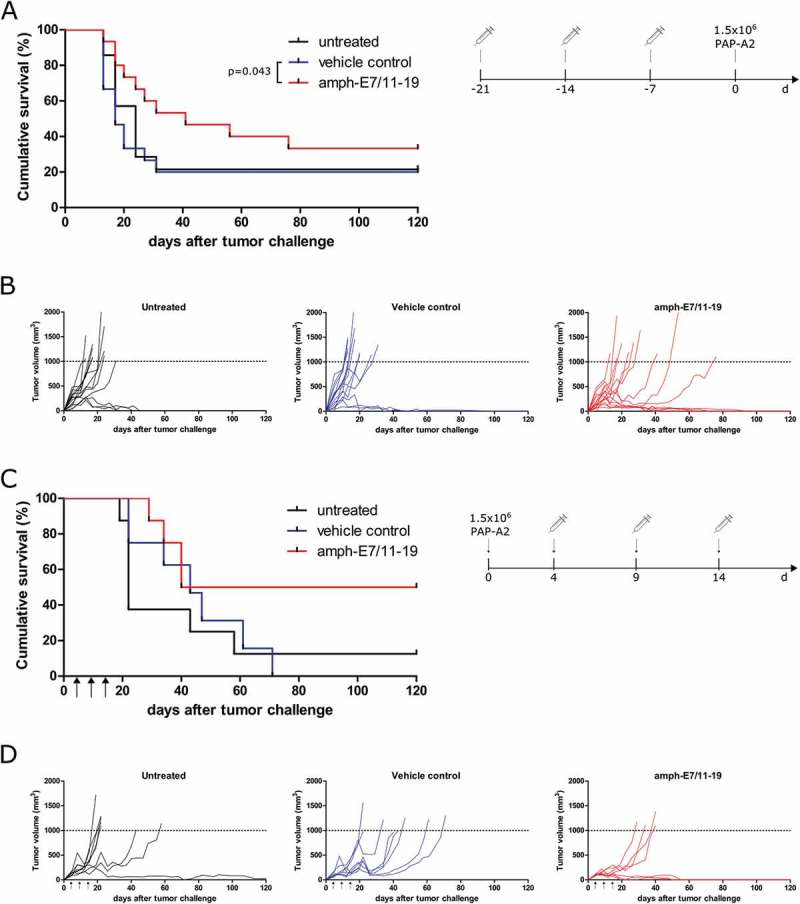
Figure 3.

Prophylactic and therapeutic vaccination with amph-E7/11–19 reduces the growth of PAP-A2 tumors. (A, B) A2.DR1 mice (n = 15 per group for amph-E7/11–19 and vehicle, n = 14 for untreated) were treated with three injections of amph-E7/11–19 or controls and were challenged 7 days after the last vaccination with 1.5x10⁶ PAP-A2 cells. A: Cumulative survival curves of groups, B: Tumor growth curves of individual mice. (C, D) A2.DR1 mice (n = 8 per group) were injected with 1.5x10⁶ PAP-A2 cells and were vaccinated as indicated with amph-E7/11–19, vehicle control or left untreated. C: Cumulative survival curves of groups, D: Tumor growth curves of individual mice. Statistical analysis for differences in survival was performed with the Gehan-Breslow-Wilcoxon test.
