Figure 7.

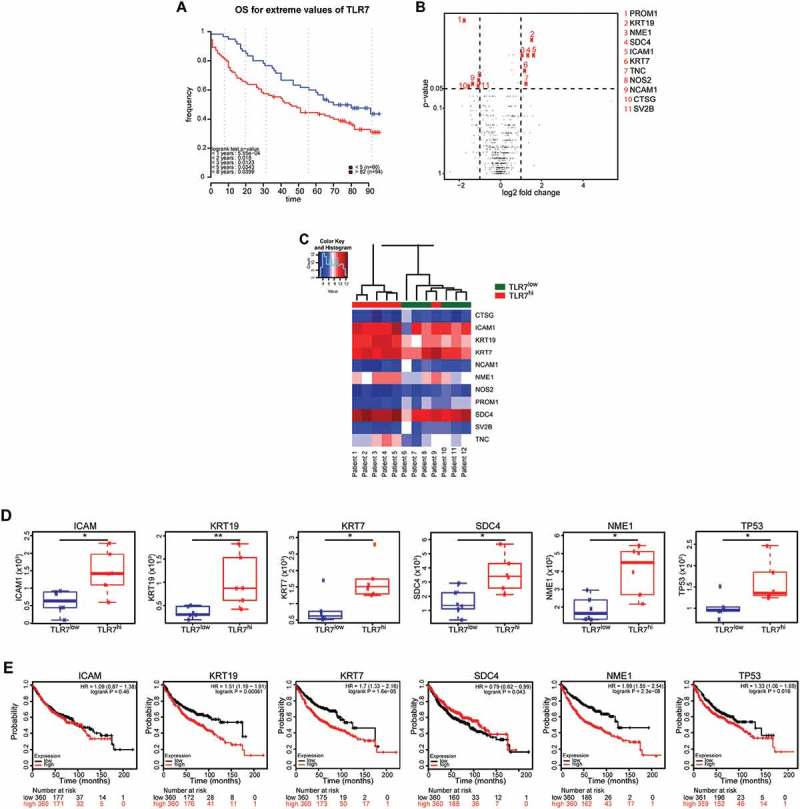
High expression of TLR7 by malignant adenocarcinoma cells is associated with metastatic gene expression signature.
Kaplan-Meier survival curve for overall survival (OS) for the 154 lung adenocarcinoma patients, divided in two groups according to the stratification of TLR7 expression. Optimal cutoff of 82% was previously determined 11. Patients are divided into TLR7hi (> 82% expression of TLR7) and TLR7low group (< 5% TLR7 expression). p-value was determined by log-rank test (A). Gene expression analysis was performed in 12 adenocarcinoma patients including 6 TLR7hi and 6 TLR7low, using nanostring technology. Volcano plot comparison of differentially expressed genes between TLR7hi and TLR7low group of patients. The horizontal dimension is the variation of median gene expression (log2 (ratio)) between the 2 groups, and the vertical axis represents the Mann-Whitney test p-value between TLR7hi and TLR7low patients. In red are represented genes that are over-or under-expressed in TLR7hi patients, with a fold-change superior to 2 (11 genes among 770 studied) (B). Hierarchical clustering of the 11 differentially expressed genes in TLR7hi compared to TLR7low groups. Individual patients are oriented in columns and expression level for each gene is oriented in rows (C). Box plot representation of ICAM1, KRT-19, KRT-7, SCD4, NME1, and P53 gene expression in TLR7hi and in TLR7low patients (D). Kaplan-Meier survival curve for overall survival (OS) for adenocarcinoma patients divided in two groups according to the stratification of ICAM1, KRT-19, KRT-7, SCD4, NME1, and P53 gene expression, using online survival analysis software KM plotter. p value was determined by log-rank test (E).
