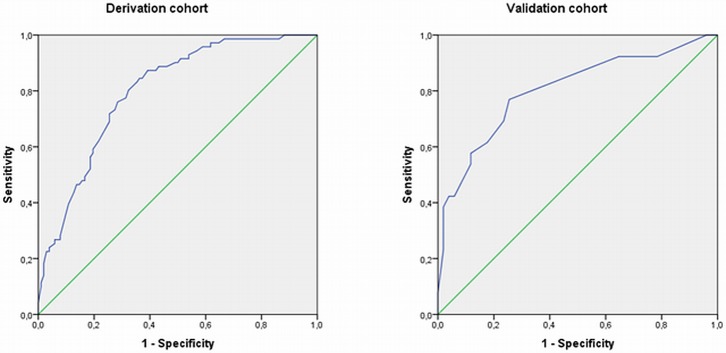
Fig 2. ROC curves for the prediction models of MTX insufficient response (DAS28>3.2) in the derivation (left panel) and validation (right panel) cohorts.
Area under receiver operating characteristics curve was 0.80 (95%CI: 0.73–0.86) in the derivation cohort and 0.80 (95%CI: 0.69–0.91) in the validation cohort.

