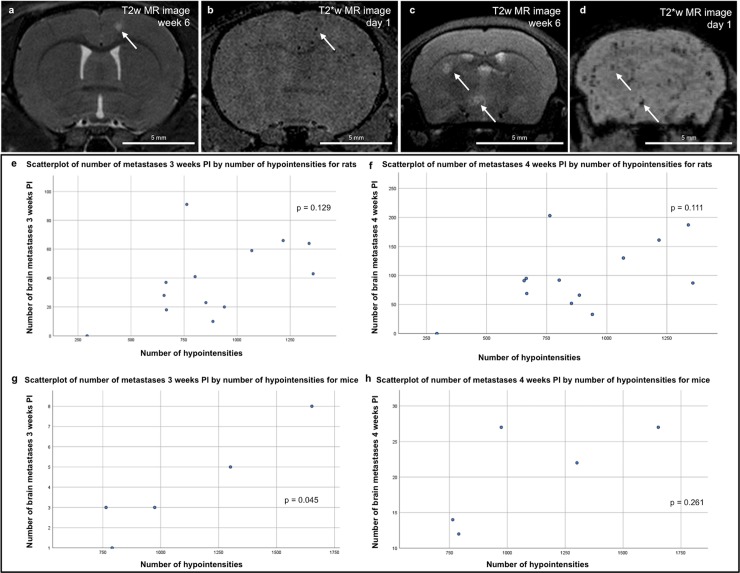
Fig 2. Correlation of brain metastasis and hypointensities.
a-b. Rat brain metastasis visible on a T2w image (a) could be correlated to a corresponding hypointense signal void on a T2*w image (b) as indicated with an arrow. c-d. Mouse brain metastases visible on a T2w image (c) could be correlated to corresponding signal voids on a T2*w image (d) as indicated with an arrow. e-h. Scatterplots describe the relation between ‘number of hypointensities’ and ‘number of brain metastases’ for rats (n = 13) injected with MPIO-labeled cancer cells 3 and 4 weeks PI (e and f, respectively) and mice (n = 5) injected with MPIO-cancer cells 3 and 4 weeks PI (g and h, respectively).

