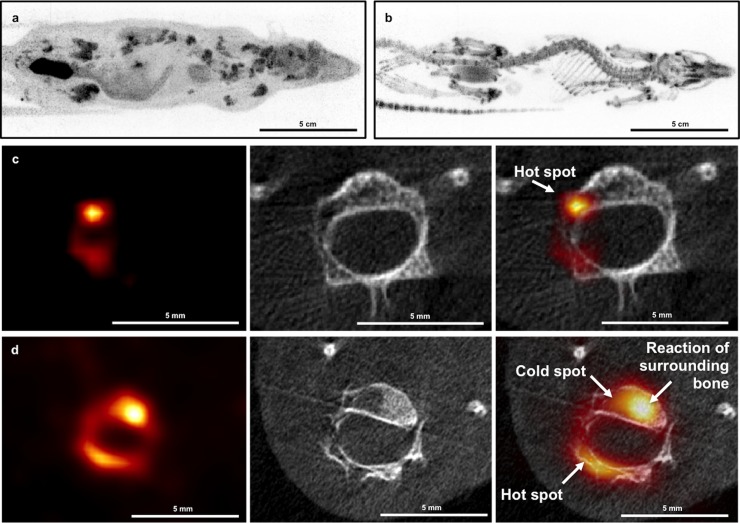
Fig 5. [18F]FDG and [18F]NaF PET imaging in rats.
a. Static whole-body rat [18F]FDG PET image. b. Static whole-body rat [18F]NaF PET image. c. PET-CT image of rat vertebra; [18F]FDG PET image anatomically correlated with high resolution CT (recon: FDK—50 μm). This lytic lesion is clearly visible on the [18F]FDG PET images as a hypermetabolic lesion (‘hot spot’) d. PET-CT image of rat vertebra; [18F]NaF PET image anatomically correlated with high resolution CT (recon: FDK—50 μm). The bone lesions have a mixed appearance: both ‘hot spots’ and ‘cold spots’ are visualized in the lytic CT lesions, probably depending on the stage of destruction and reaction of the surrounding bone.

